Server Monitoring and Job Management
Advanced server monitoring and job management features have made troubleshooting server related errors and managing jobs easier for administrators. Proactively monitoring server health, preventing server downtimes, and identifying the causes of server failure is also made possible with the improved server monitoring and logging capabilities.
Moreover, a diagnostic file can be generated in case of server failure that contains information such as server status, server health, active connections, installed drivers etc. Administrators can use this information to troubleshoot and fix the problems.
The server monitoring features that we will discuss in this article are:
- Using Job Monitor to monitor jobs scheduled on the server
- Viewing Server Properties
- Creating Diagnostics File to troubleshoot server related issues
- Viewing Server Information
- Managing cluster databases through Cluster Monitor and Settings
Let’s go over each of them one by one.
Job Monitor
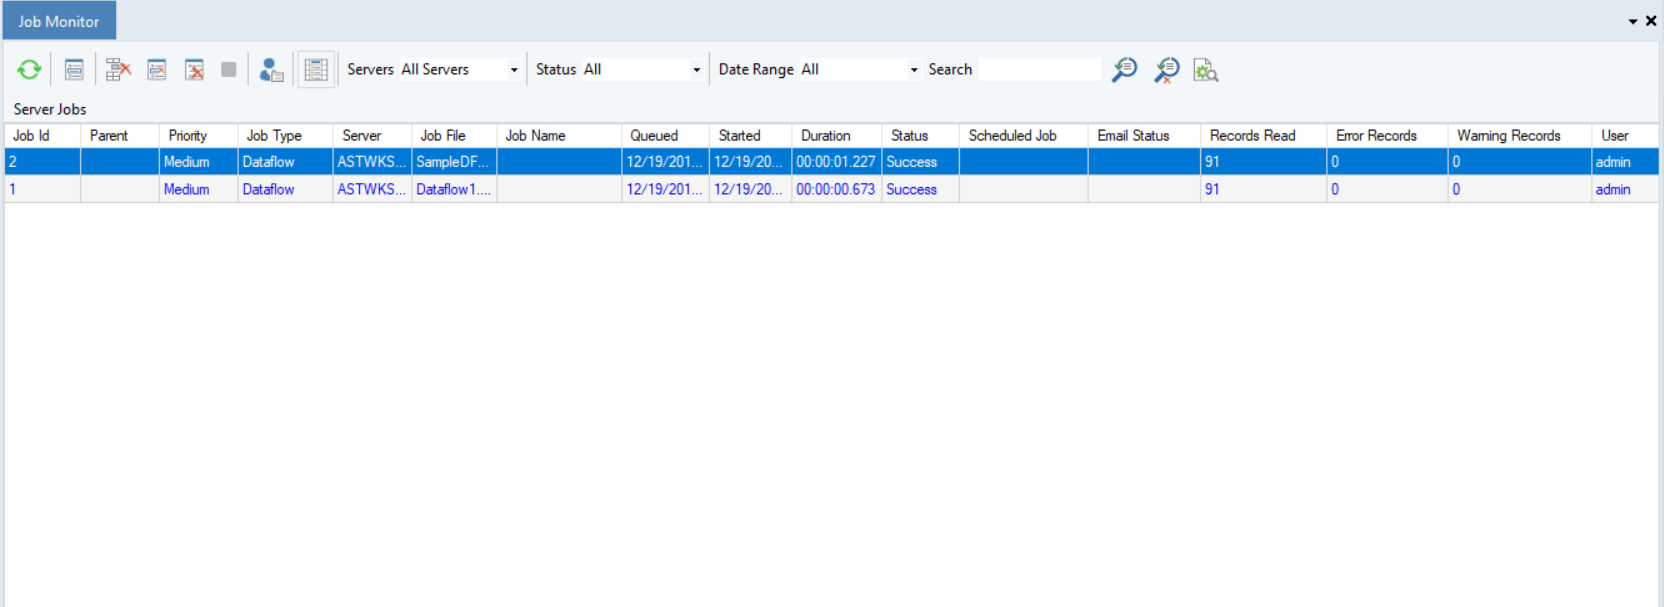
The Job Monitor will show you information regarding all the jobs (running, scheduled, or executed) on Centerprise server.
The Job Monitor gives following details:
1. Job ID
2. Parent
3. Priority
4. Job Type
5. Server
6. Job File
7. Job Name
8. Queued
9. Started
10. Duration
11. Status
12. Scheduled Job
13. Email Status
14. Records Read
15. Error Records
16. Warning Records
17. User
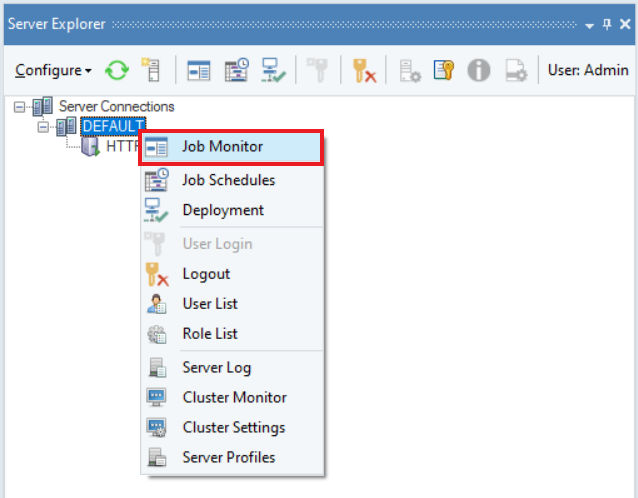
To open the Job Monitor, go to Server Explorer > Right Click on Default > Job Monitor.
Server Properties
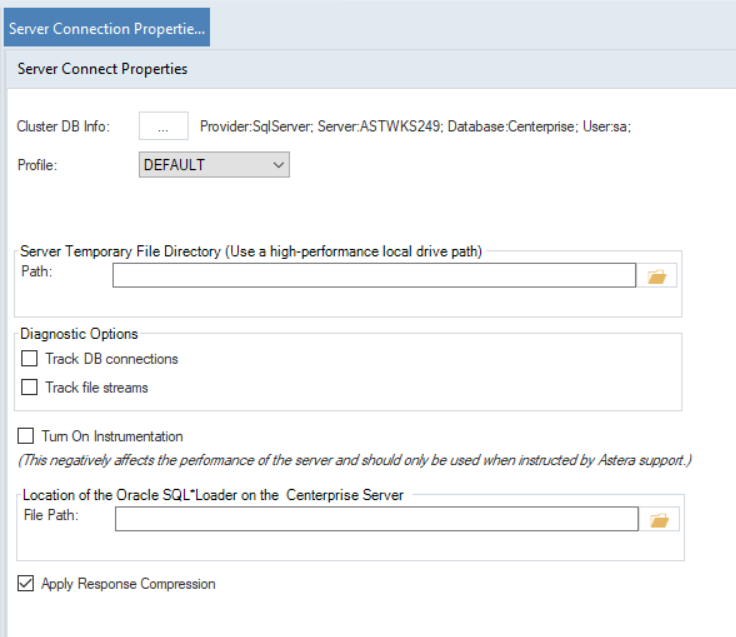
The server connection properties window gives information about the cluster database and options for the diagnostics file. It can also be used to change the cluster database connection at any instance.
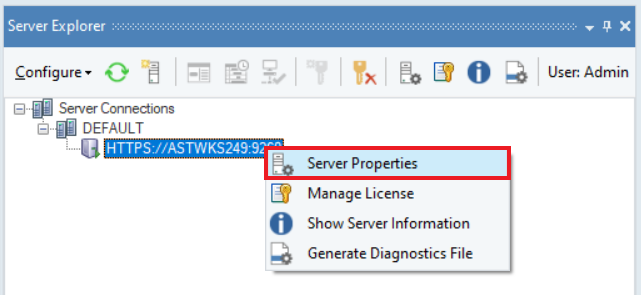
To open the Server properties, go to Server Explorer > Right click on the connected Server node > Server Properties. A server connection properties screen will open.
Generating a Diagnostics File
A diagnostics file is generated in case of server failure or downtime. The diagnostics file is used to troubleshoot the causes for failure or downtime. It works as a performance and health monitor for Centerprise server.
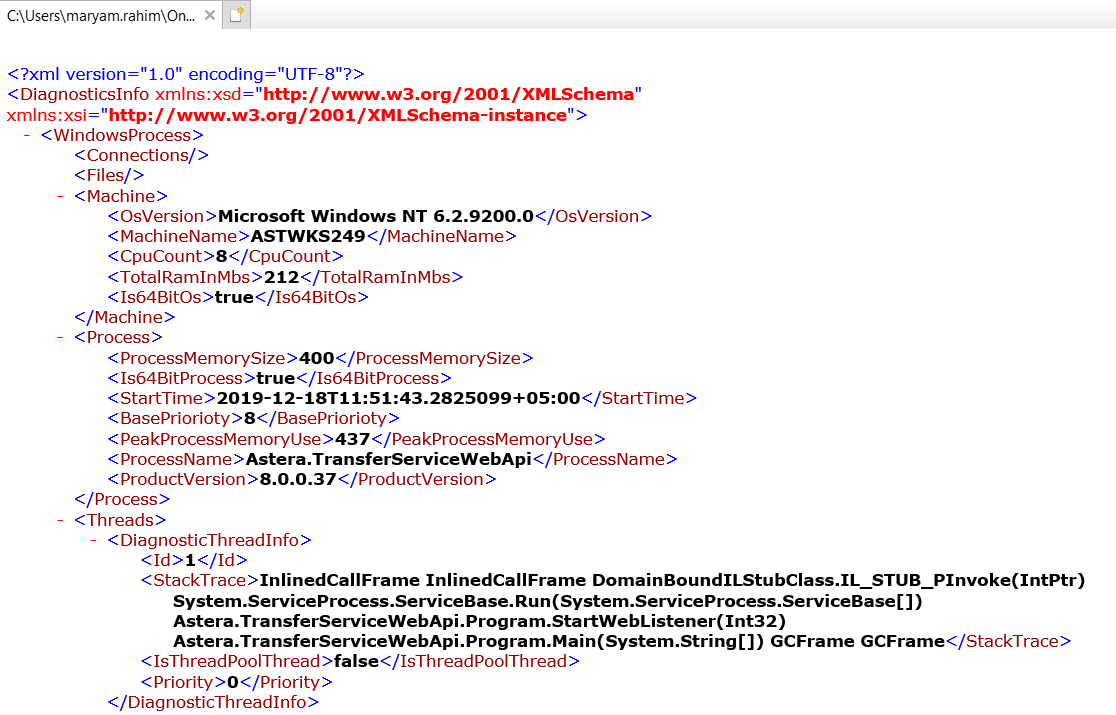
Information included in the diagnostics file is as follows:
- Operating System
- Machine Information
- Error Information
- Server Information
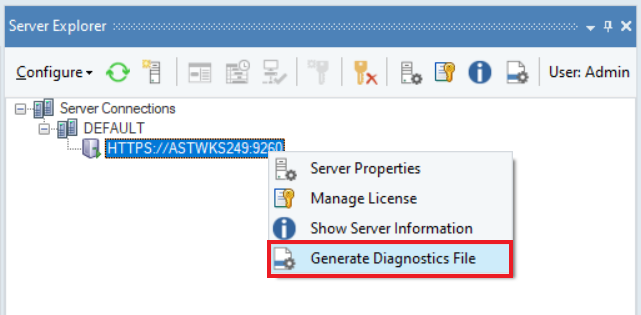
To generate a diagnostics file, go to Server Explorer > Right Click on the connected server node > Generate Diagnostics File. It will ask you for a file path where you want to save the file.
Once the file is saved, you can open the file from the given file path, and an XML file will open.
Server Information
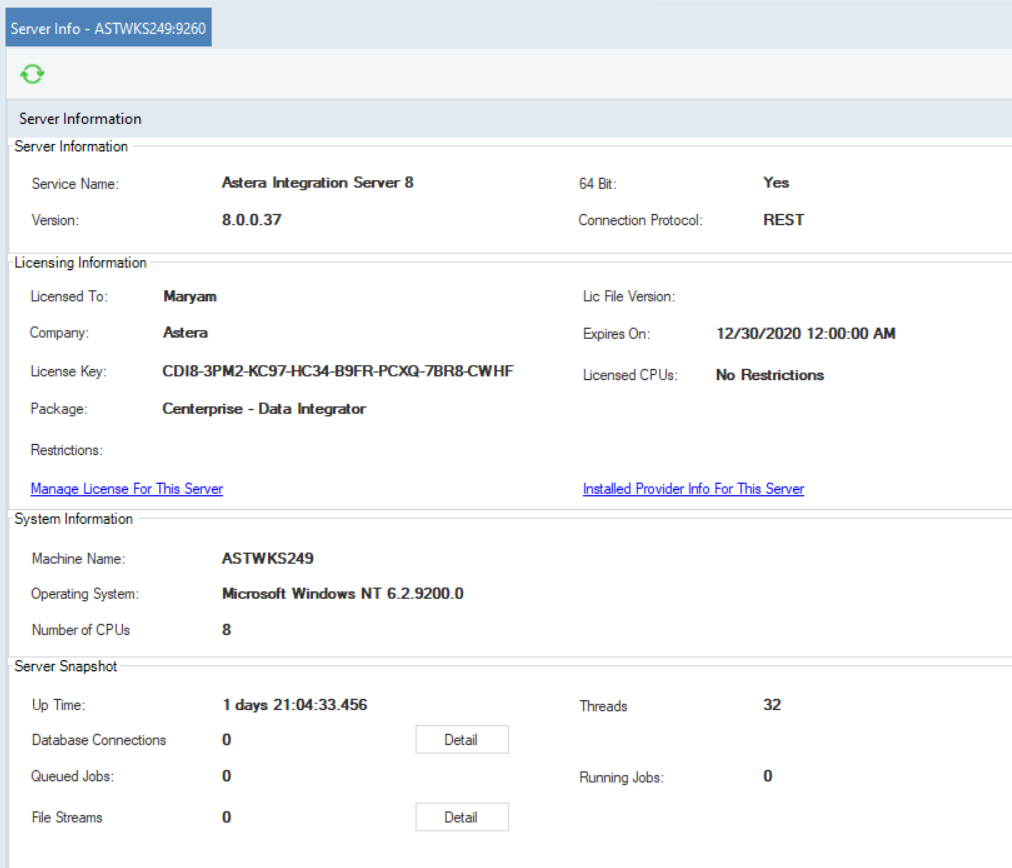
To view details related to the server, Centerprise provides information regarding the connected server and machine through this option for easier management.
Server Information screen will show the following specifics:
1. Server Information
2. Licensing Information
3. System Information
4. Server Snapshot
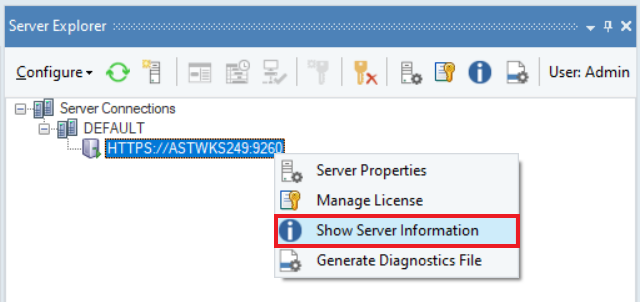
To access Server Information, go to Server Explorer > Right Click on the connected server node > Show Server Information.
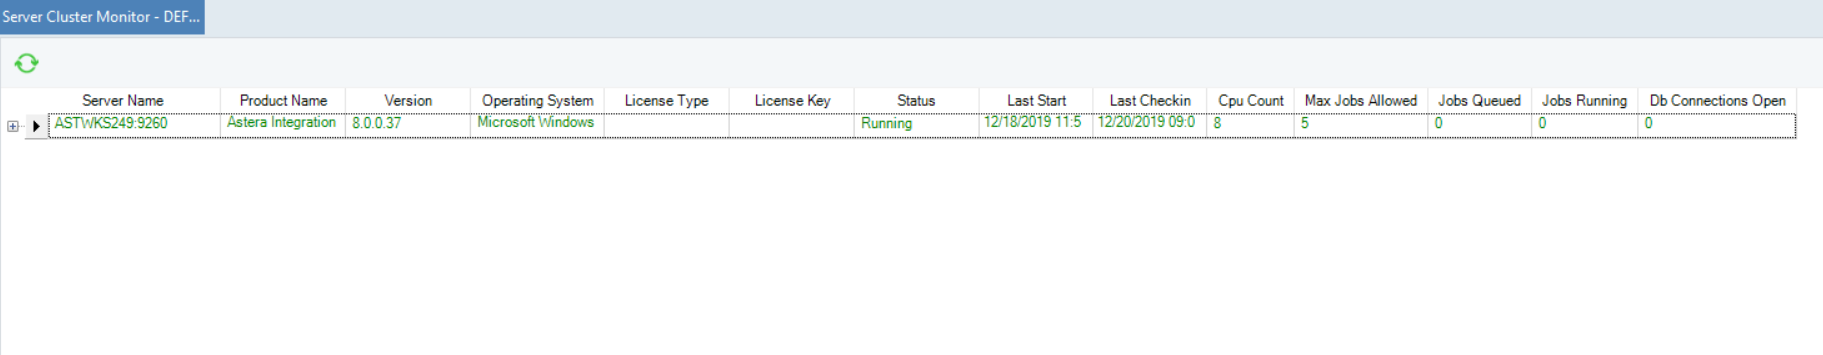
Cluster Monitor and Settings
The cluster monitor and settings help in managing the cluster database that you’ve made for Centerprise.
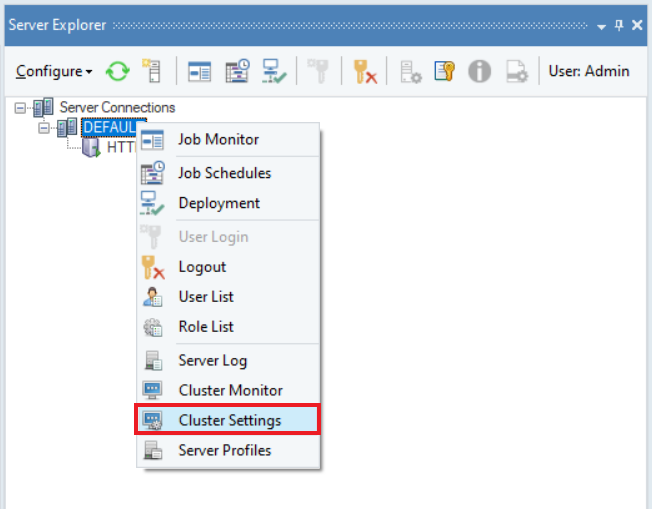
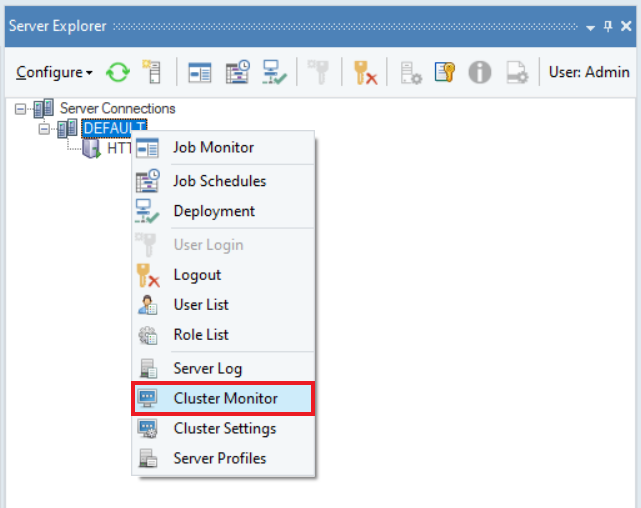
To open the Cluster Monitor, go to the Server Explorer > Right Click on Default > Cluster Monitor.
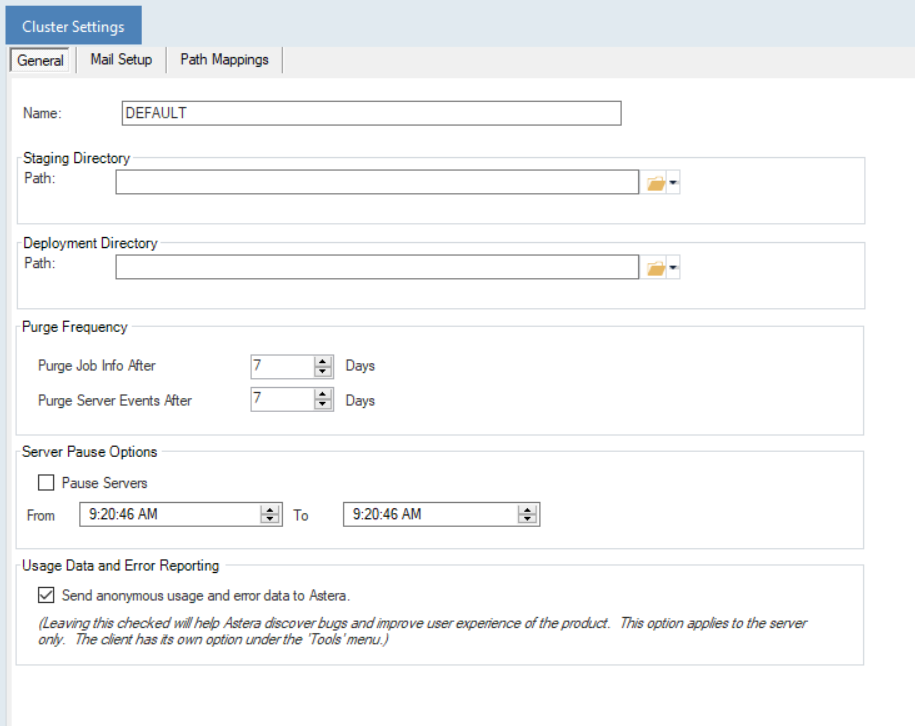
In the Cluster Settings, you can:
- General: Give staging and deployment directory paths.
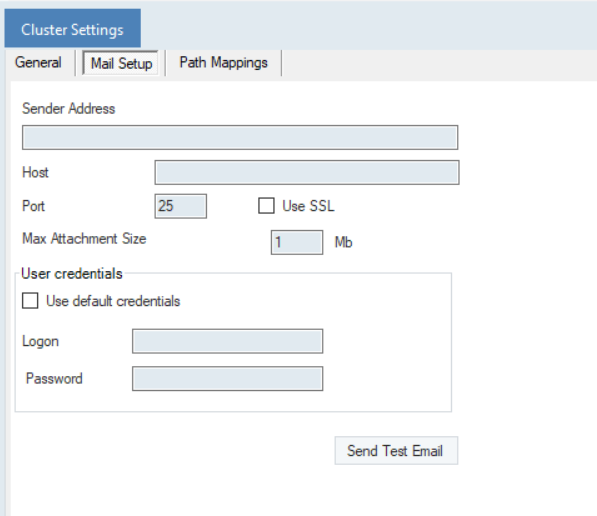
- Mail Setup: Provide with credentials to support mailing for job automation.
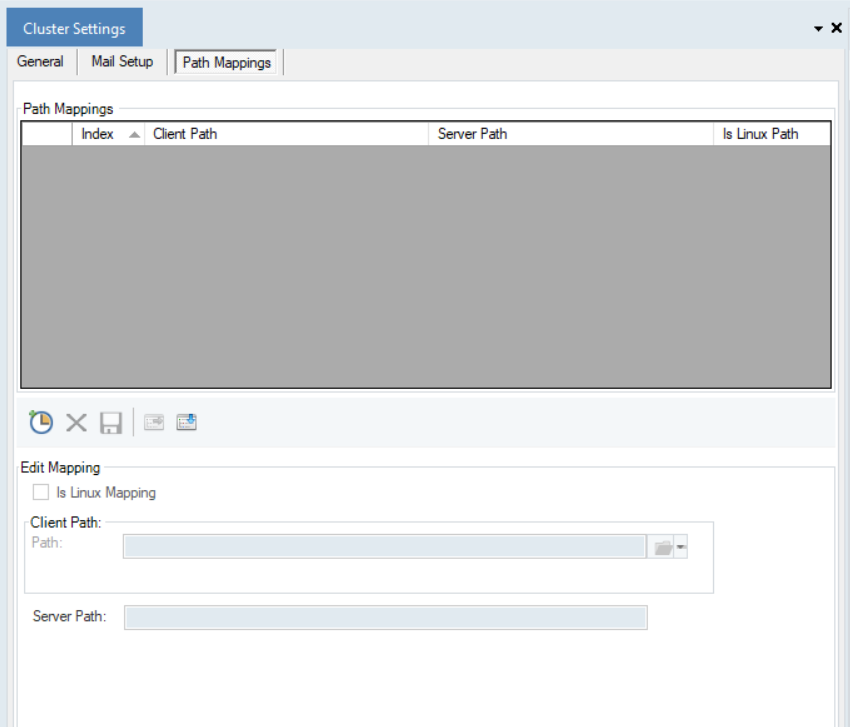
- Path Mapping: Provides alternate paths for directory.
To open the Cluster Settings, go to the Server Explorer > Right Click on Default > Cluster Settings.