Correlation Analysis
The Correlation Analysis object enables users to compute a two-way association between several numeric data fields. The strength of association is measured by computing correlation coefficients.
In Astera Centerprise - Data Analytics Edition, users have the option to compute three different types of correlation coefficients:
1. Pearson Correlation: A measure for investigating the strength of association between two quantitative continuous variables, for example, age and height.
2. Spearman’s Rank Correlation: A measure for investigating the strength of association between two ordinal scale rank variables with mutually exclusive ranks. For example, two physicians ranking a patient’s condition from worst to best.
3. Kendall’s Tau Correlation: A non-parametric measure of the relationship between columns of ranked data. For example, two interviewers ranked ten candidates as per their performance in the interview.
The coefficient’s value varies between -1 to 1, with ±1 indicating a perfect or 100% association, while a coefficient value of 0 suggests zero association between the numeric data fields. The higher the magnitude of the coefficient, the stronger the correlation between two variables.
The mathematical sign of coefficient value determines the slope inclination; positive (+) sign indicates an upward slope whereas negative (-) sign indicates a downward slope. Therefore, a positive coefficient indicates that the two variables are directly related, whereas a negative coefficient indicates that the two variables are inversely proportional.
In this document, we will learn to perform Correlation Analysis on a set of numeric data in Astera Centerprise.
Sample Use-Case
In this case, we are using a Delimited File Source object to extract the source data. You can download this sample data file from here.
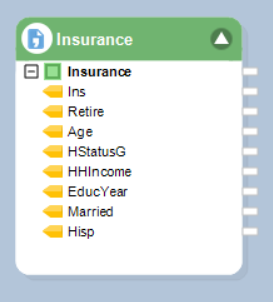
The source file contains information on the demographics of individuals who bought the insurance policy as well as those who chose otherwise.
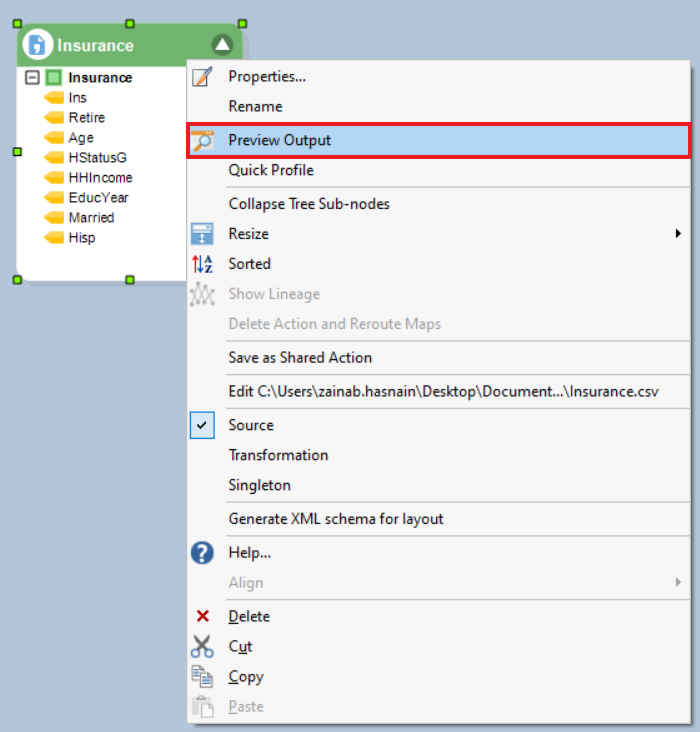
You can preview this data by right-clicking on source object’s header and selecting Preview Output.
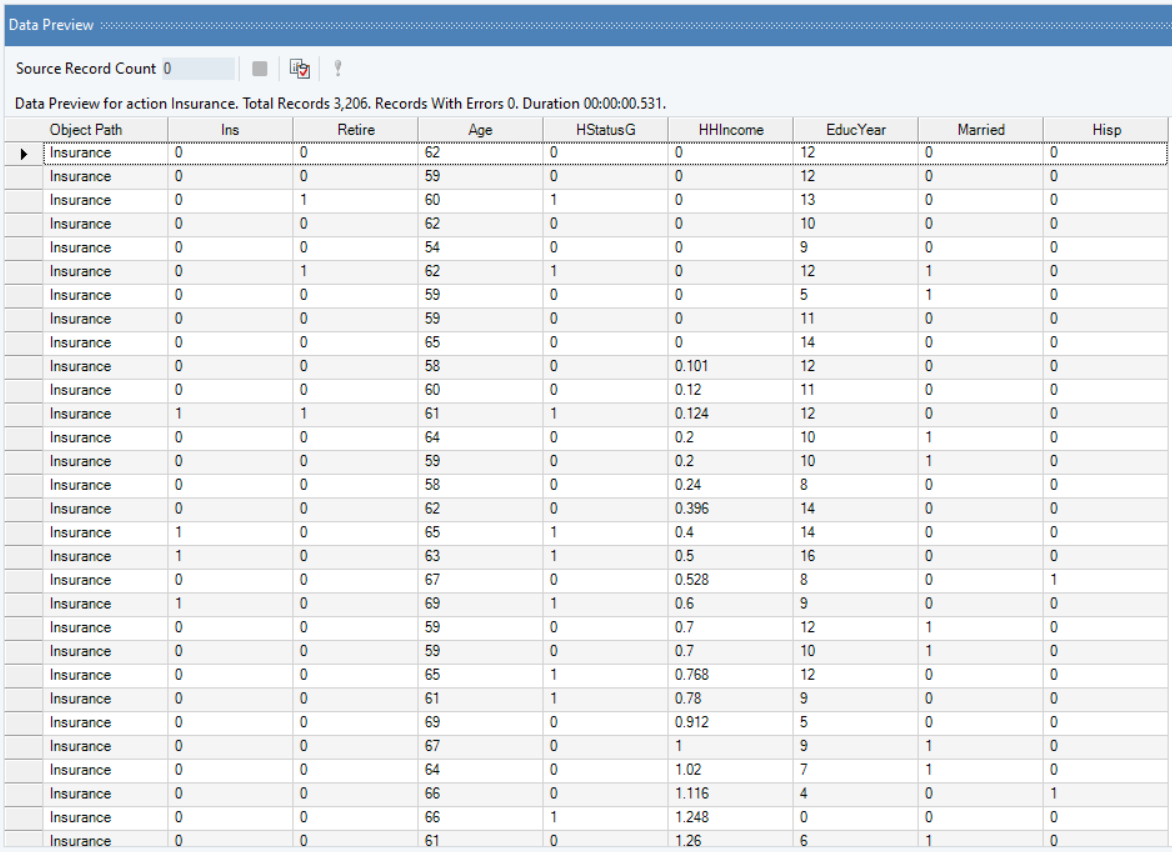
A Data Preview window will open, previewing the insurance data.
Now, we want to figure out the strength of association between these numeric data fields to assess which fields are highly correlated and which fields have low correlation.
For this purpose, we will use the Correlation Analysis object in Astera Centerprise.
Using Correlation Analysis
1. To get a Correlation Analysis object from the Toolbox, go to Toolbox > Testing and Diagnostics > Correlation Analysis and drag-and-drop the testing object onto the dataflow designer.
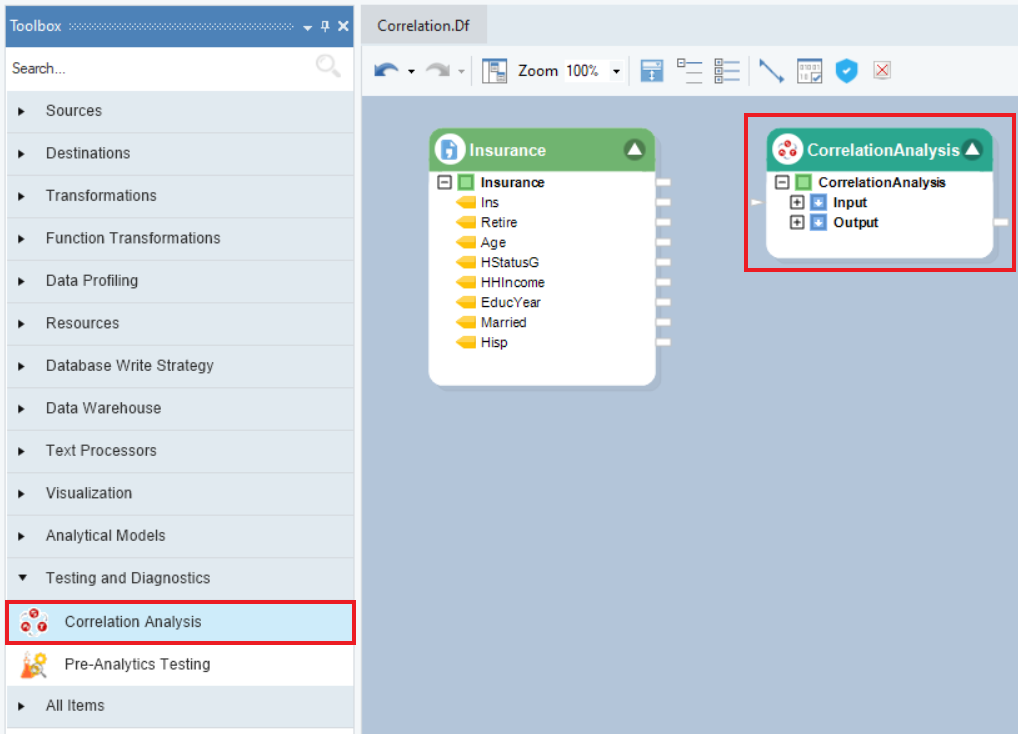
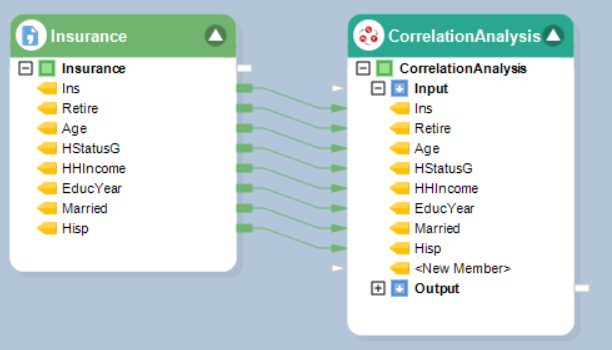
2. The testing object contains two sub-nodes, Input and Output. Auto-map the source fields by dragging-and-dropping the root node of the source object onto the Input node of the Correlation Analysis object.
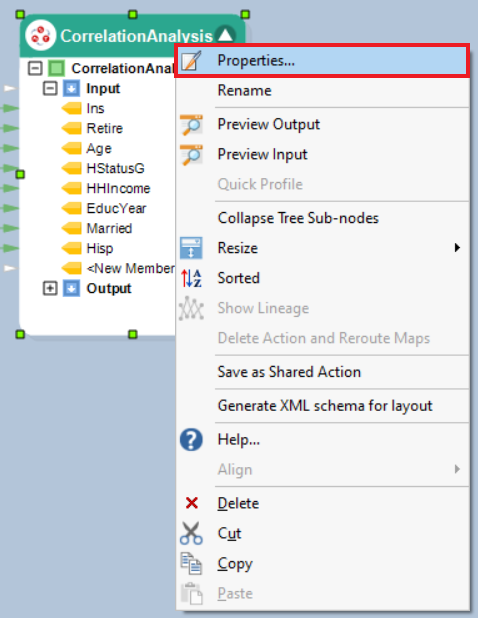
3. Right-click on the object’s header and select Properties from the context menu.
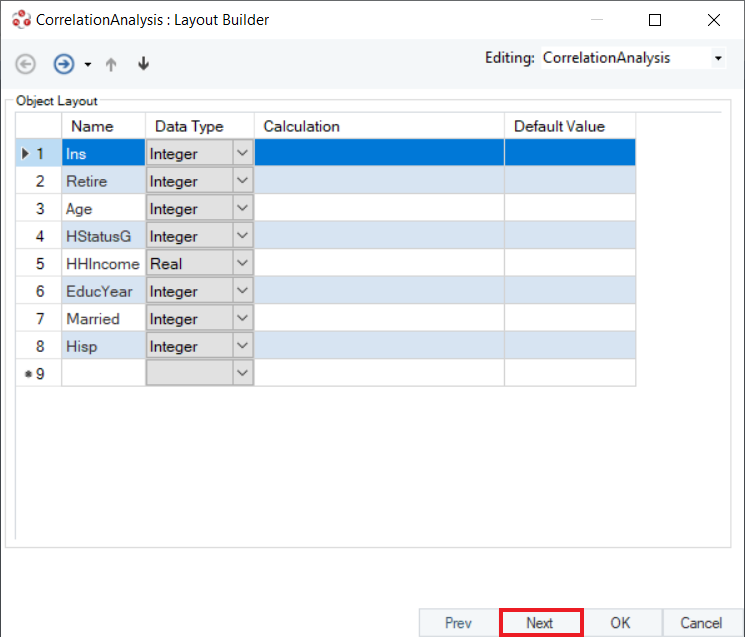
4. A configuration window will open, as shown below. This is the Layout Builder, where users can delete fields, change the Name or Data Type and modify fields with Calculation. Click Next.
5. This is the Properties window that contains configuration options.
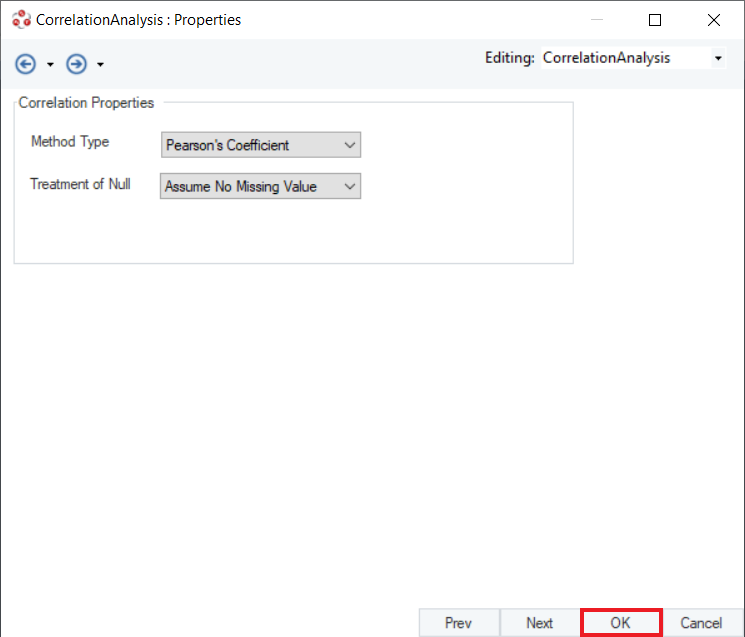
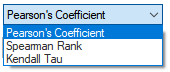
Method Type: Specifies the type of correlation coefficient to compute, depending on the content of the data and its type. The options available are Pearson, Spearman or Kendall.
Treatment of Null: Specifies the handling of missing data. By default, it is set to Assumes No Missing Value, as missing data produces an error. There are two more options:
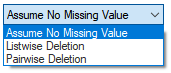
- Listwise Deletion: Removes only the missing cell from the data.
- Pairwise Deletion: Removes the entire row of data if any one fields contains an empty cell.
In this example, the source data is neither ranked nor on an ordinal scale. Hence, we will select Pearson’s Correlation Coefficient and leave Treatment of Null option as default. Click OK.
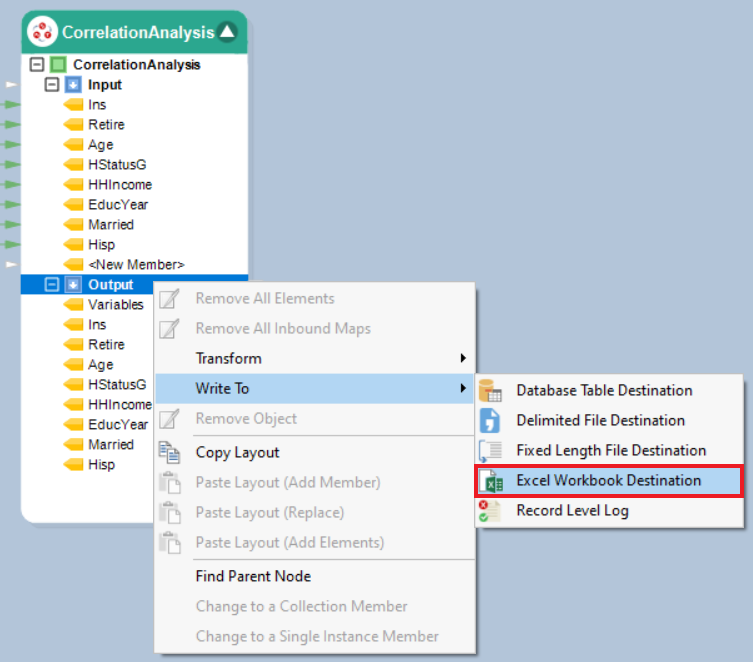
6. Right-click on the Output node of Correlation Analysis object and go to Write to > Excel Workbook Destination.
7. Configure the Excel Workbook Destination object to save the correlation output. To perform this step, refer to the article here.
8. Right-click on the Correlation Analysis object and select Preview Output. In the Data Preview window, the preview shows the Pearson’s Correlation Coefficients computed for each variable with the rest of the numeric data fields.
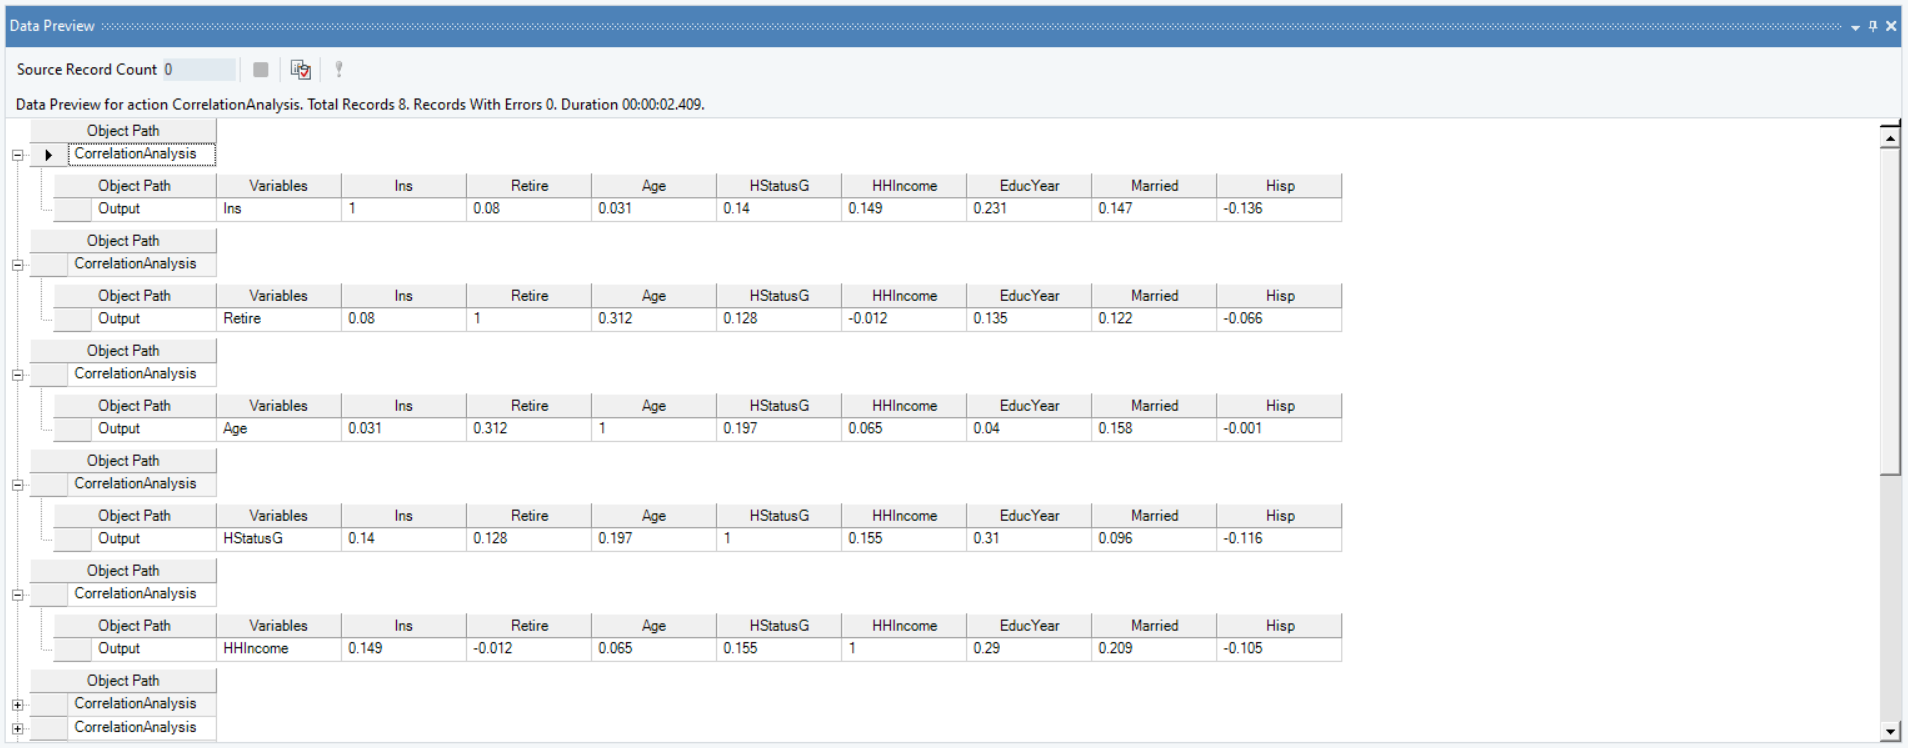
By looking at the magnitude and the sign of the coefficient, we can deduce that the highest positive correlation exists between the variables Age and Retire. This means that the higher the age, the higher the chances of a person being retired.
Whereas, the highest negatively correlated variables are EducYear and Hisp. Meaning, if the person is Hispanic, he is more likely to have fewer number of years of education, according to our Correlation Analysis.
This concludes the document on using Correlation Analysis in Astera Centerprise - Data Analytics Edition.