Lineage and Impact Analysis
Astera Centerprise allows its users to perform lineage and impact analysis on certain data items (tables, fields). The purpose of lineage is to be able to trace the origin or roots of a data item and the transformations it has undergone. On the other hand, impact analysis shows how the data present within an item is consumed, used, and modified with its respective pipeline(s). It also shows which data items or pipelines (i.e., workflows, dataflows, schedules or deployments) are impacted by a change/modification in the component, thereby helping to understand the potential risks and dependencies associated with the changes.
How to Generate Lineage and Impact Analysis
Step 1: Deploy the Project
To be able to generate lineage and impact graphs for data items that are being used/processed within dataflows, those dataflows should be part of a project that is deployed on the Astera Integration Server. To learn how you can deploy a project, click here.
Step 2: Generate Lineage and Impact for all Active Deployments
The next step is to generate lineage and impact for all the active deployments on the server.
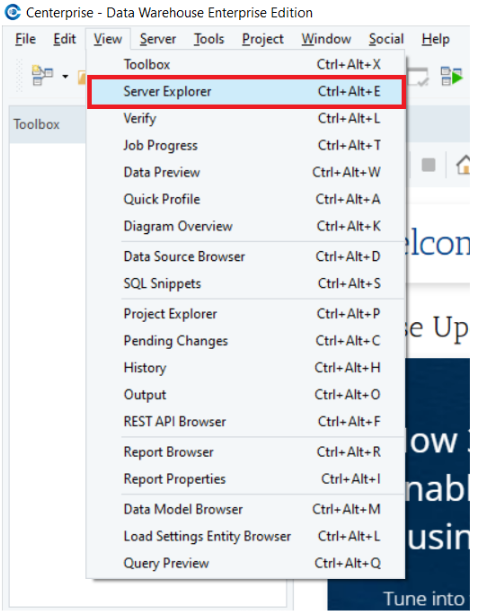
1. Go to the Server Explorer. If you can’t see this panel, go to View > Server Explorer in the main menu.
2. On the Server Explorer panel, right-click on the server name and select Generate Lineage and Impact from the context menu.
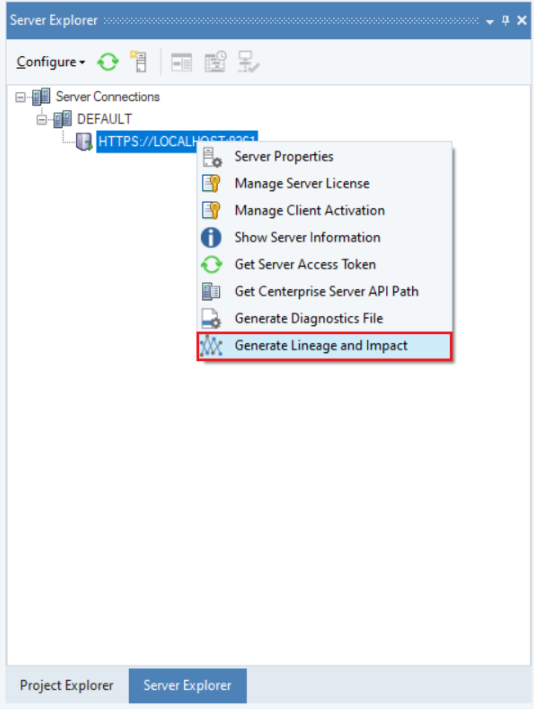
When you select this option, the product will automatically generate lineage and impact for the items being processed/used in all the projects that have been deployed on the server.
Step 3: Preview the Lineage and Impact via the Data Source Browser
The Data Source Browser can be used to access all the tables (and their fields) from a particular database. To learn about how you can use the Data Source Browser, click here.
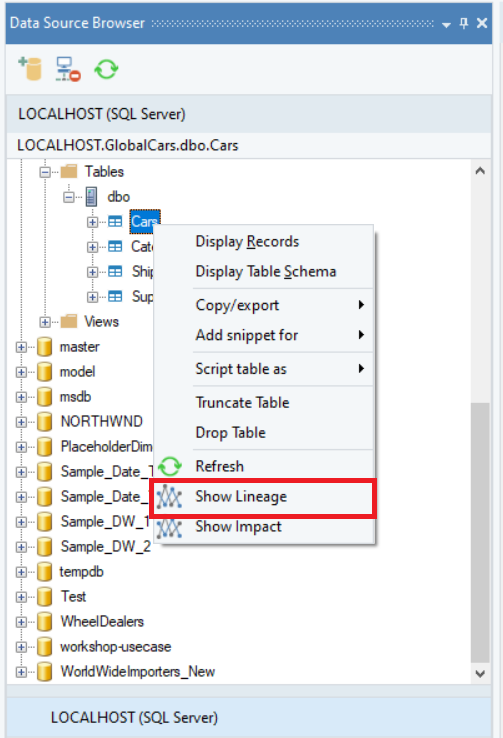
To display a lineage graph for a particular table or field from within the Data Source Browser, right-click on that table/field and select Show Lineage from the context menu.
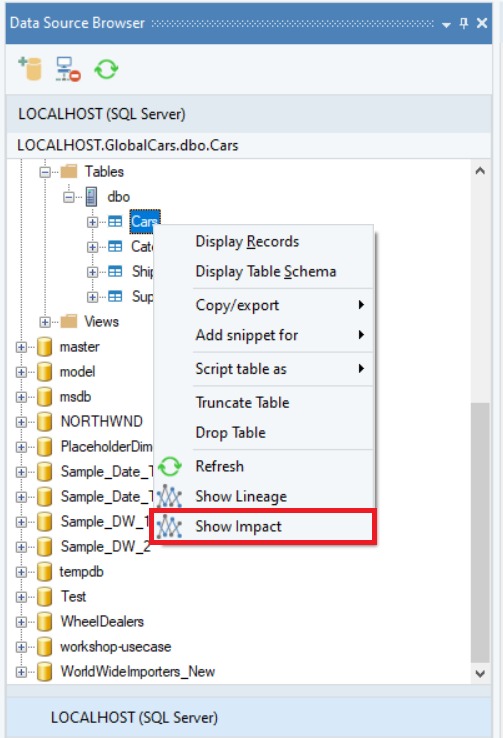
Similarly, to display an impact graph for a particular table or field from within the Data Source Browser, right-click on that table/field and select Show Impact from the context menu.
A relevant lineage/impact graph will be displayed within the client application when you select one of these options. However, for that to happen, the table/field that you’ve chosen should have been used in at least one of the deployed projects for which you’ve already generated lineage and impact analysis (refer to the previous step).
Lineage and Impact Graphs
There are two types of views available for lineage and impact, the Graph View and the Grid View.
Graph View
The graph view shows a graphical visual of the lineage and impact generated. Here is a sample lineage graph for a database table that is displayed in the client application. It shows a graphical visual to trace the origins of the destination database table for which the lineage has been generated.
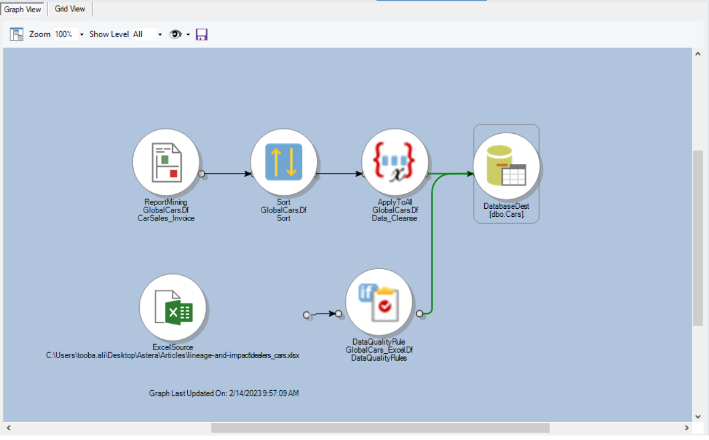
Let’s Explore the different options provided in the ‘Graph View’.
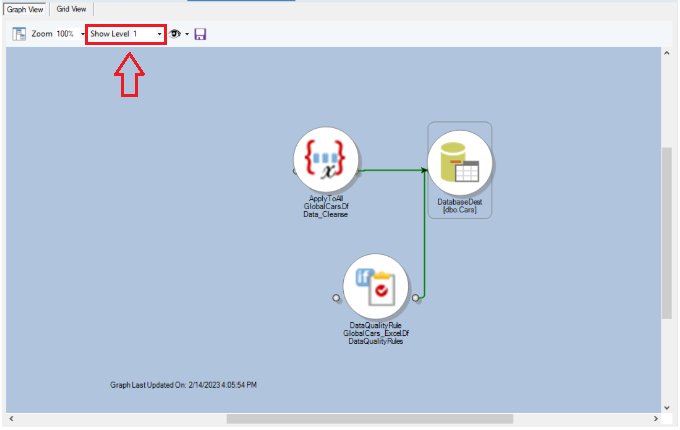
1. The ‘Show Level’ option can be used to show different levels of detail of lineage and impact analysis. For instance, when the Level is changed from ‘All’ to ‘1’, a less detailed view of the lineage and impact analysis is shown in the Graph View, showing only the most immediate transformations affecting the destination.
2. The ‘Apply Filters’ options provide multiple filters that can be applied to customize the Lineage and Impact analysis view. The filter options provided include:
· Set Transformations: Show/Hide set level transformations in the Graph View
· All Transformations: Show/Hide all transformation items in the Graph View
· Paths: Show/Hide full file path of items
· Action Name: Show/Hide action item names
· Action Alias: Show/Hide alternate names for action items
· Server and Database Information: Show/Hide Database information
· Server Information: Show/Hide Server information
3. The ‘Export Graph to Image’ option allows you to save your lineage or impact analysis graph as an image file at the desired location.
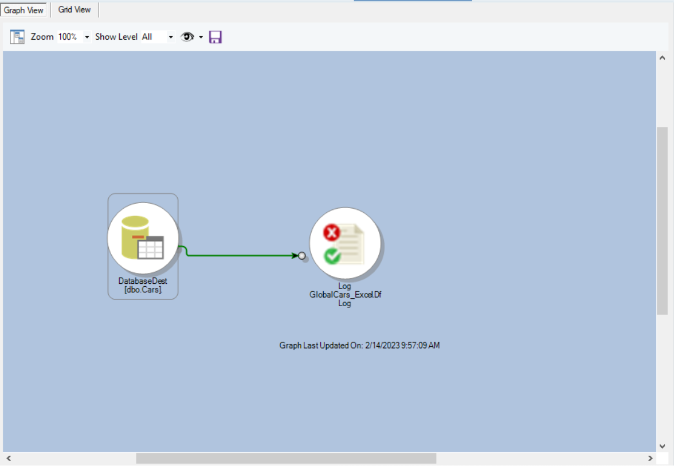
Similarly, here’s a sample impact graph for the same database table and it shows a graphical visual to determine which components are impacted if the database table for which the impact is generated is changed/modified.
Grid View
You can switch from the Graph View to Grid View using the tab at the top left of the graph.
The Grid View shows all the details of the impacted documents for the lineage and impact of a table or field in a tabular format.
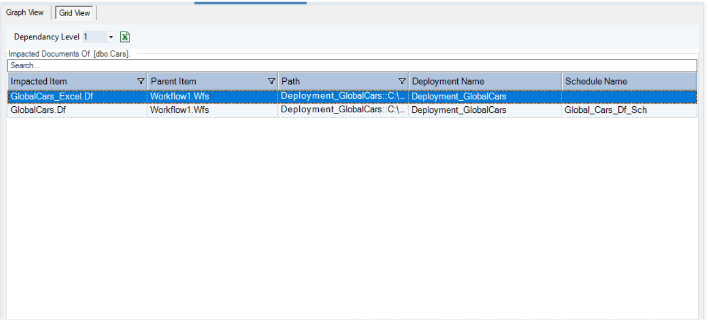
Here’s the Grid view for the lineage of a database table. It shows a table of all the flows, deployments and schedules that affect the database table destination for which the lineage has been generated.
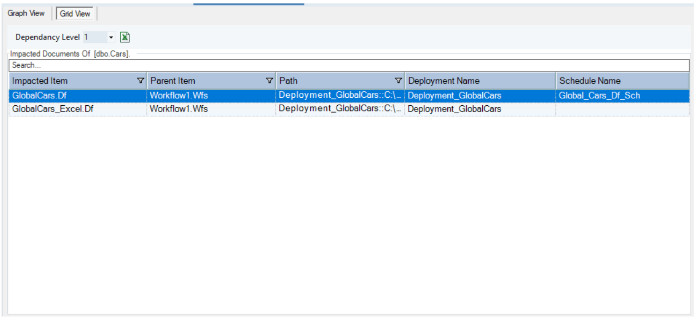
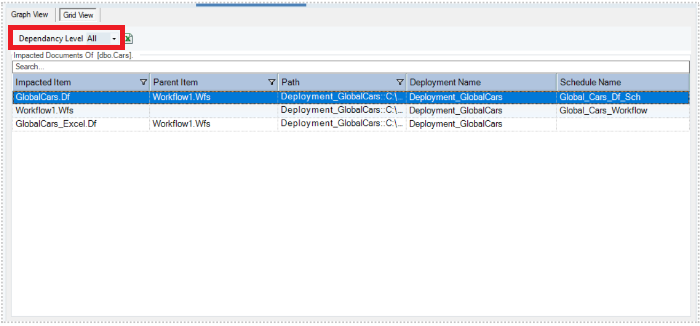
The ‘Dependency level’ option allows you to specify the level of dependency for flows in the lineage and impact analysis grid. For instance, here we have changed the Dependency level from ‘1’ to ‘All’ to show all the dependencies within the lineage analysis grid, and a more detailed view including the details of the parent items is included in the grid view.
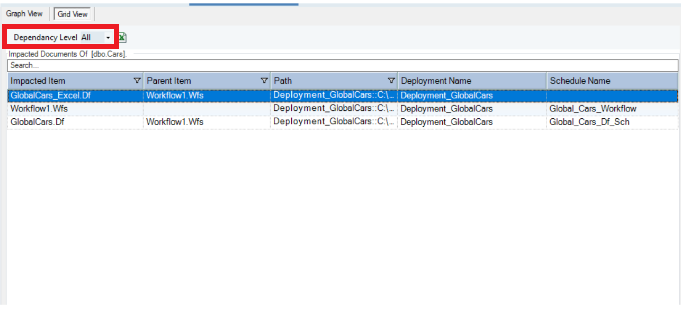
Similarly, here’s a sample impact grid view for the same table. It shows a list of all the flows, deployments and schedules that will be impacted if the database table destination for which the impact has been generated is changed/modified.
Again, the Dependency level has been changed from ‘1’ to ‘All’ to view all levels of dependencies within the impact grid view.
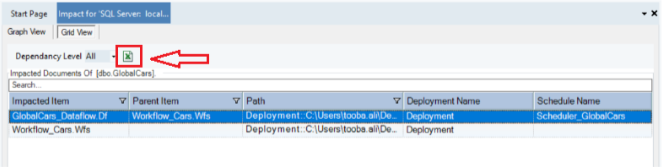
Within the Grid View, you can see a list of all the impacted items, the parent items for each of the listed items, the path of the deployed items, and a list of all the deployments and schedules that are impacted by the data item.
You can also export the grid view table to an excel sheet using the ‘Export Data to Excel’ option provided.
This concludes our discussion on how to generate graphs for lineage and impact analysis in Astera Centerprise.