Creating Multi-Column Data Regions
In this article, we will learn how to create multi-column regions in a report model so that you can read data from multiple columns.
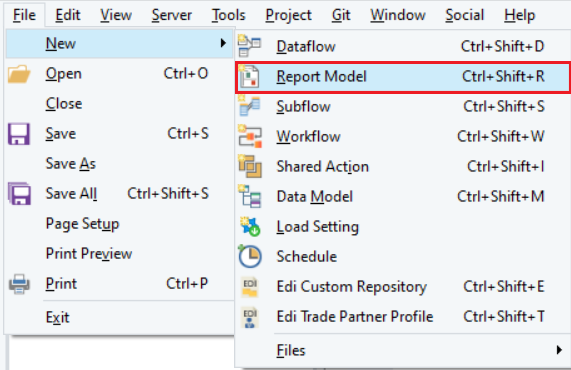
1. To create multi-column data regions in your report model, go to Files > New > Report Model.
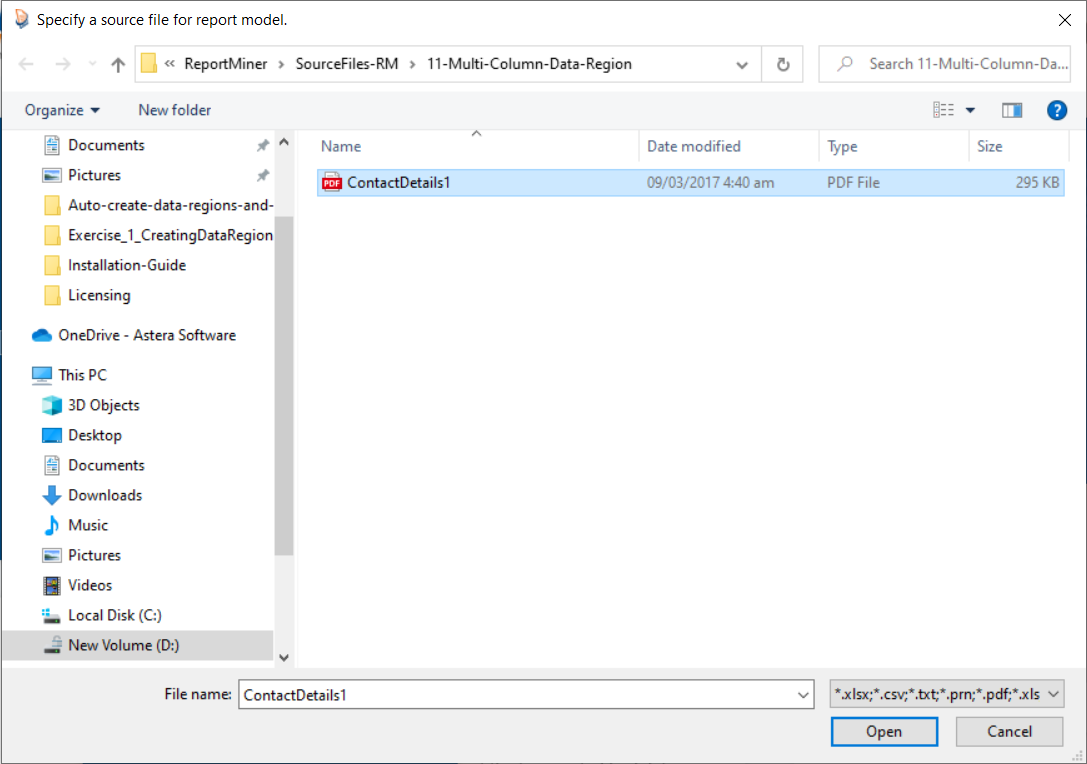
2. Now, specify the File Path of your report for which you want to build the report model.
Download the sample PDF file from here.
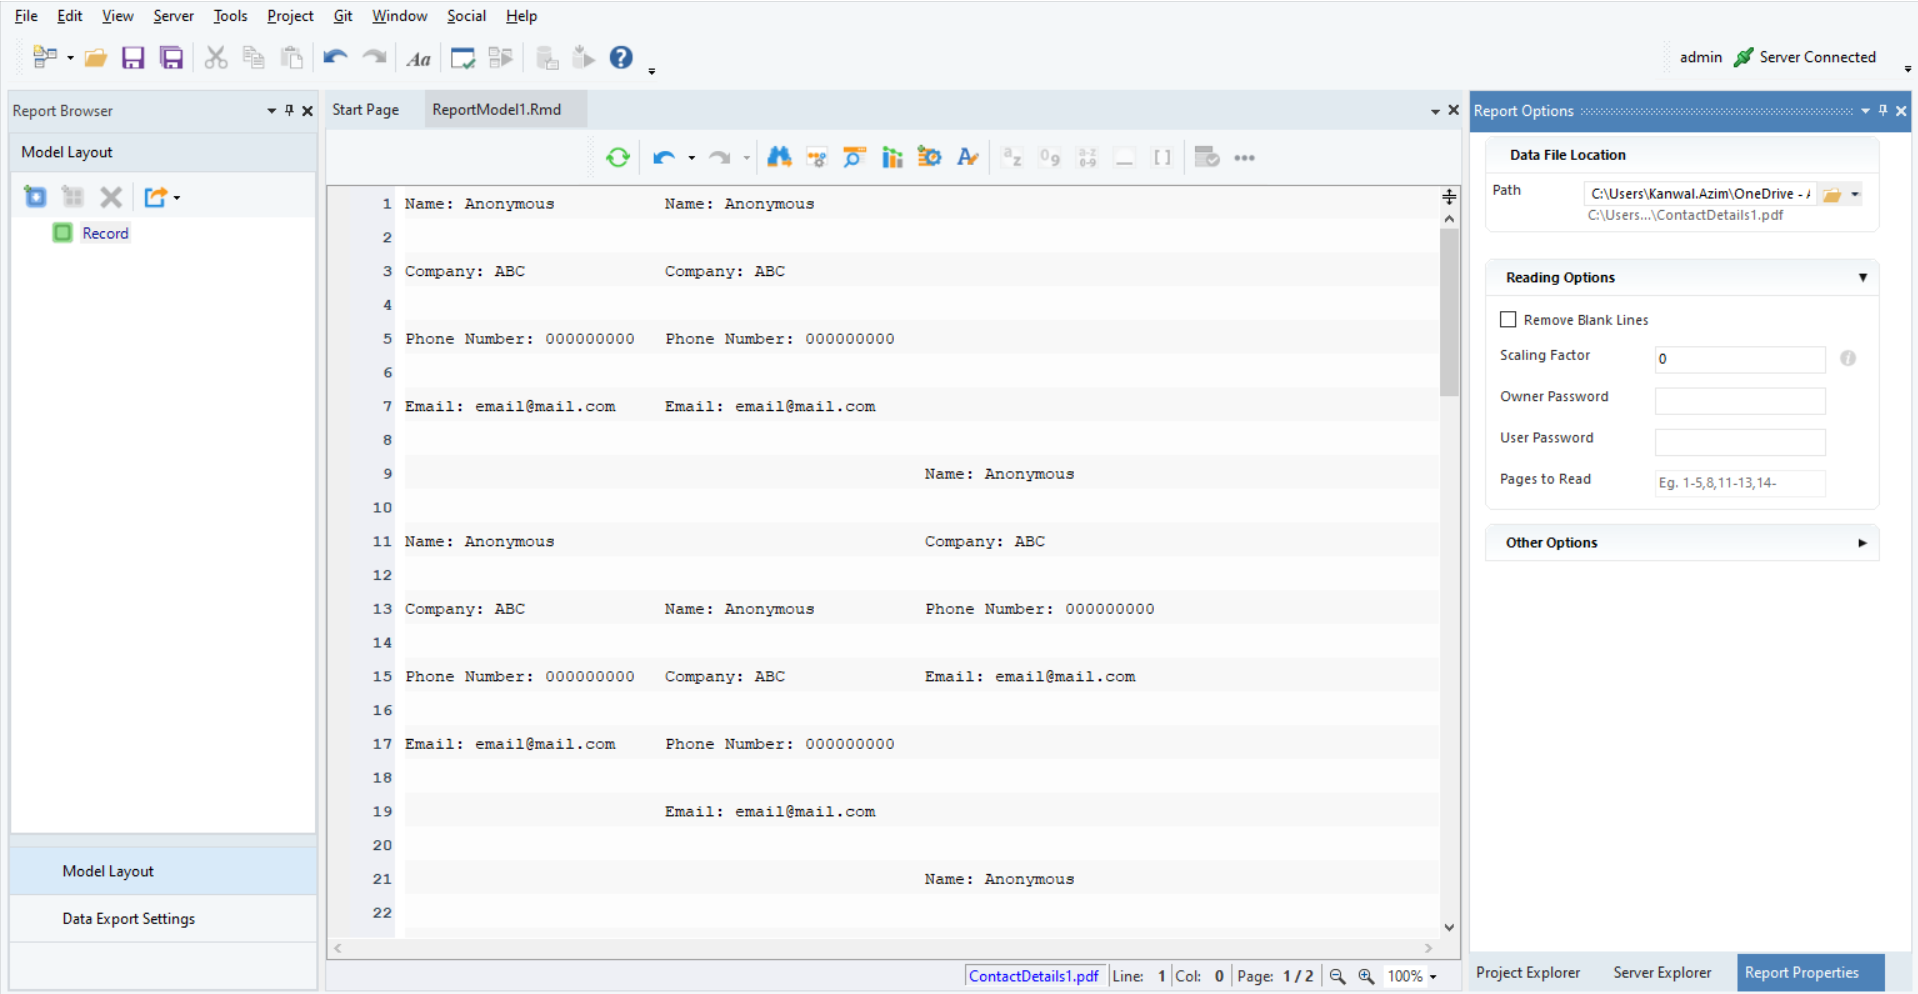
3. Your source file will be opened in the designer window where you can start building its extraction template.
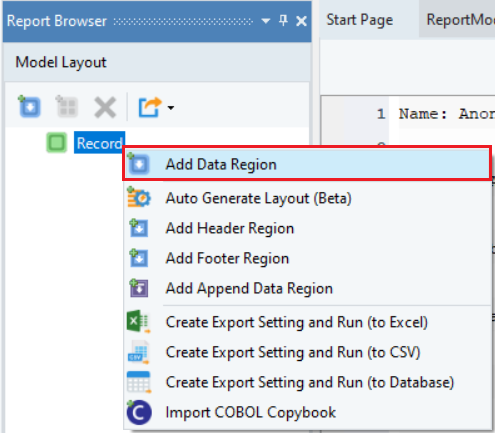
4. Right-click on the Record node present in Model Layout tpanel on the left side of your ReportMiner designer and select Add Data Region.
5. When you click Add Data Region, you will see a subnode added to Record node in the Model Layout panel. The Region Properties panel and pattern-matching bar will also appear.
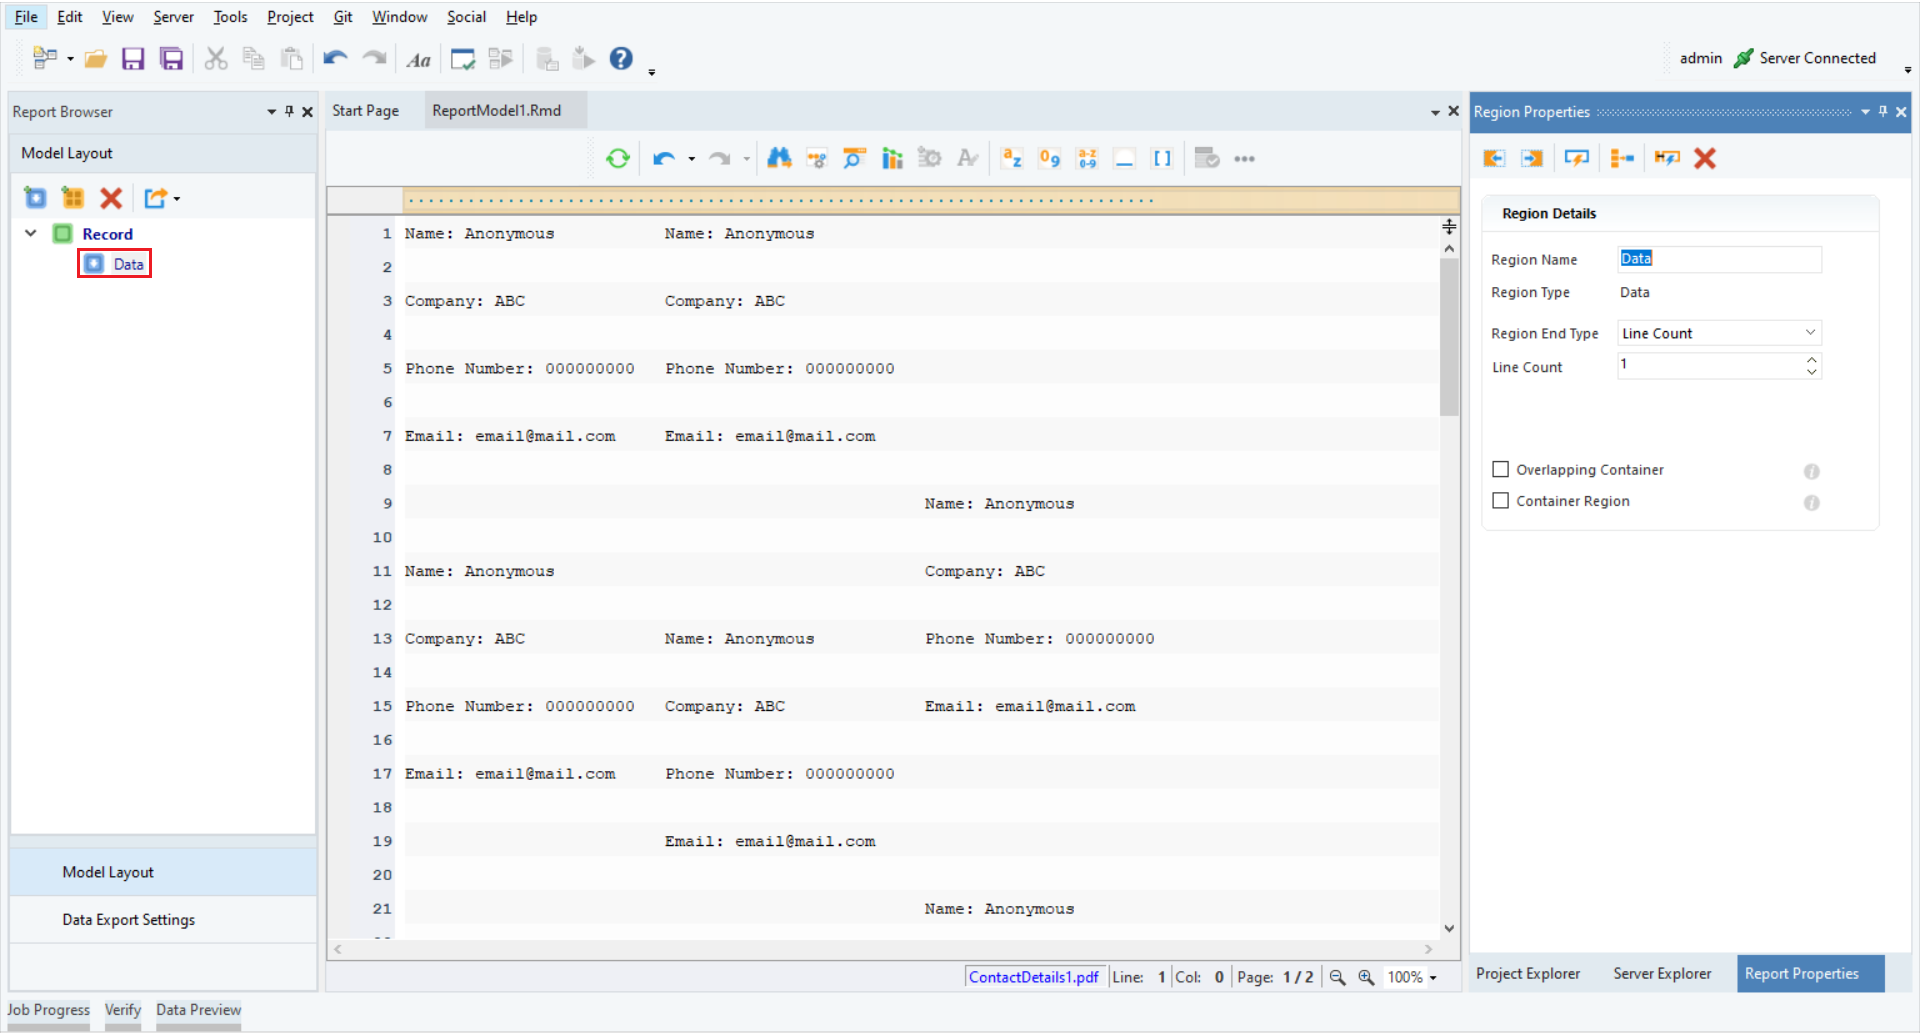
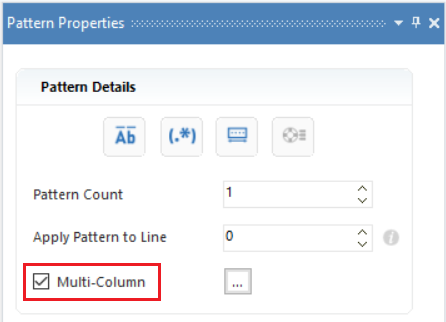
6. In the Region Properties section, you will see a check box for Multi-Column data region. Check this option.
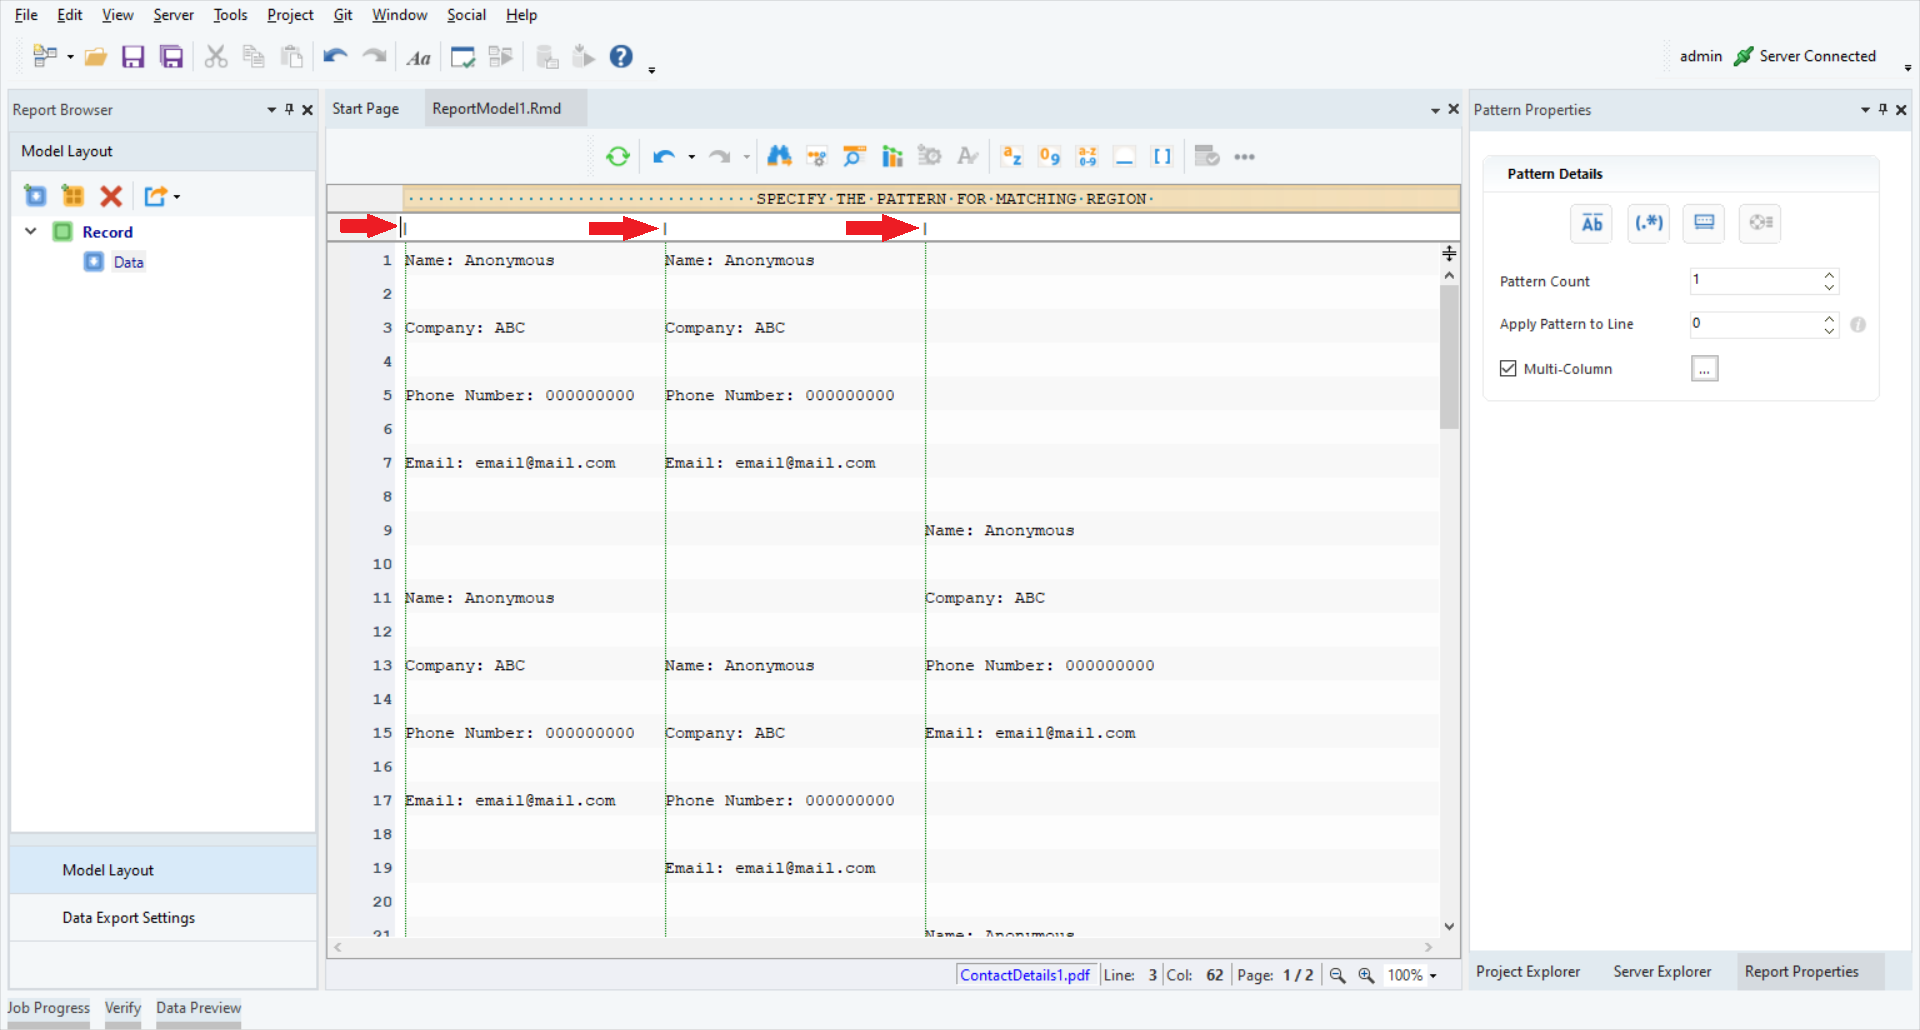
7. You will see another bar appear just below the pattern-matching bar for specifying column boundaries. Click on the second bar above your report where your first column starts. This will create a black dotted line adjacent to your text on the left side. Repeat this for each column. If alignment of your dotted line is wrong, click on it again to delete it.
The arrows show the start point for each column.
Multi-column Region Properties
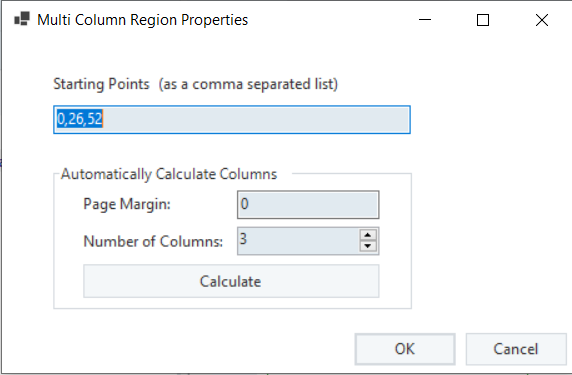
You can also adjust the Number of Columns and Page Margin by clicking on the “..“ option next to Multi-Column option.
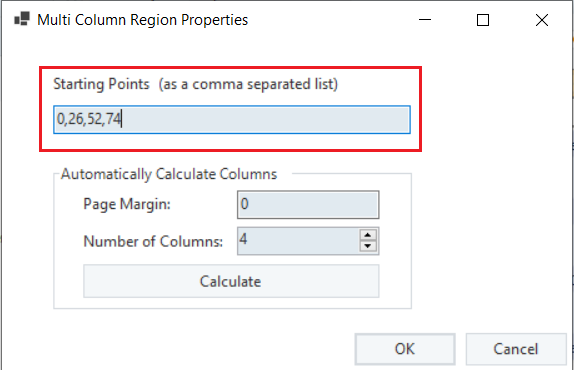
Starting Points box will show the points from where each column is starting. For instance, in this case, Column 1 is starting from “Point 0”, Column 2 from “Point 26” and Column 3 from “Point 52”.
The number of columns correspond to the number of starting points that you will see on this screen. If there are 4 columns, you will see 4 starting points.
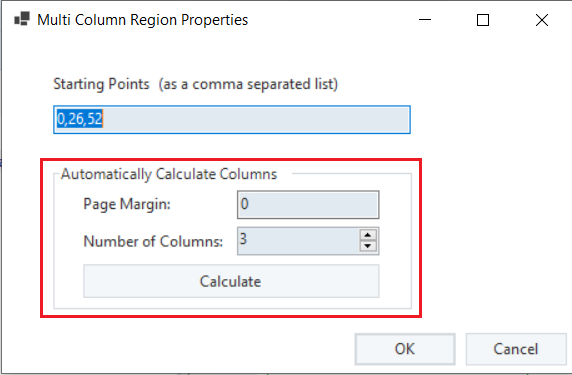
There is an option for automatically calculating columns – Automatically Calculate Columns. Here, you can specify:
- Page Margin – Where the text is starting from
- Number of Columns – Number of columns you want to have in your layout
ReportMiner will automatically calculate and place the margins on your layout.
For instance, there are 3 columns in this report and the Page Margin is 0.
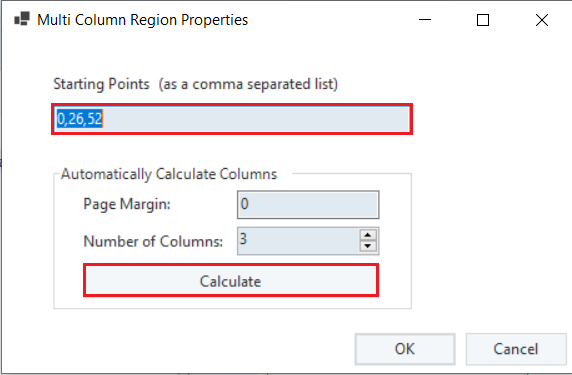
After specifying the Page Margin and Number of Columns, click on Calculate. Your starting points will be automatically calculated.
Capturing Data From Multiple Columns
1. After creating multi-column data regions, give a suitable pattern in the pattern-matching bar to select your data region.
For this model shown in the screenshot below, write “Name:” in the pattern-matching bar. You can see that it has selected data regions where the pattern matches.
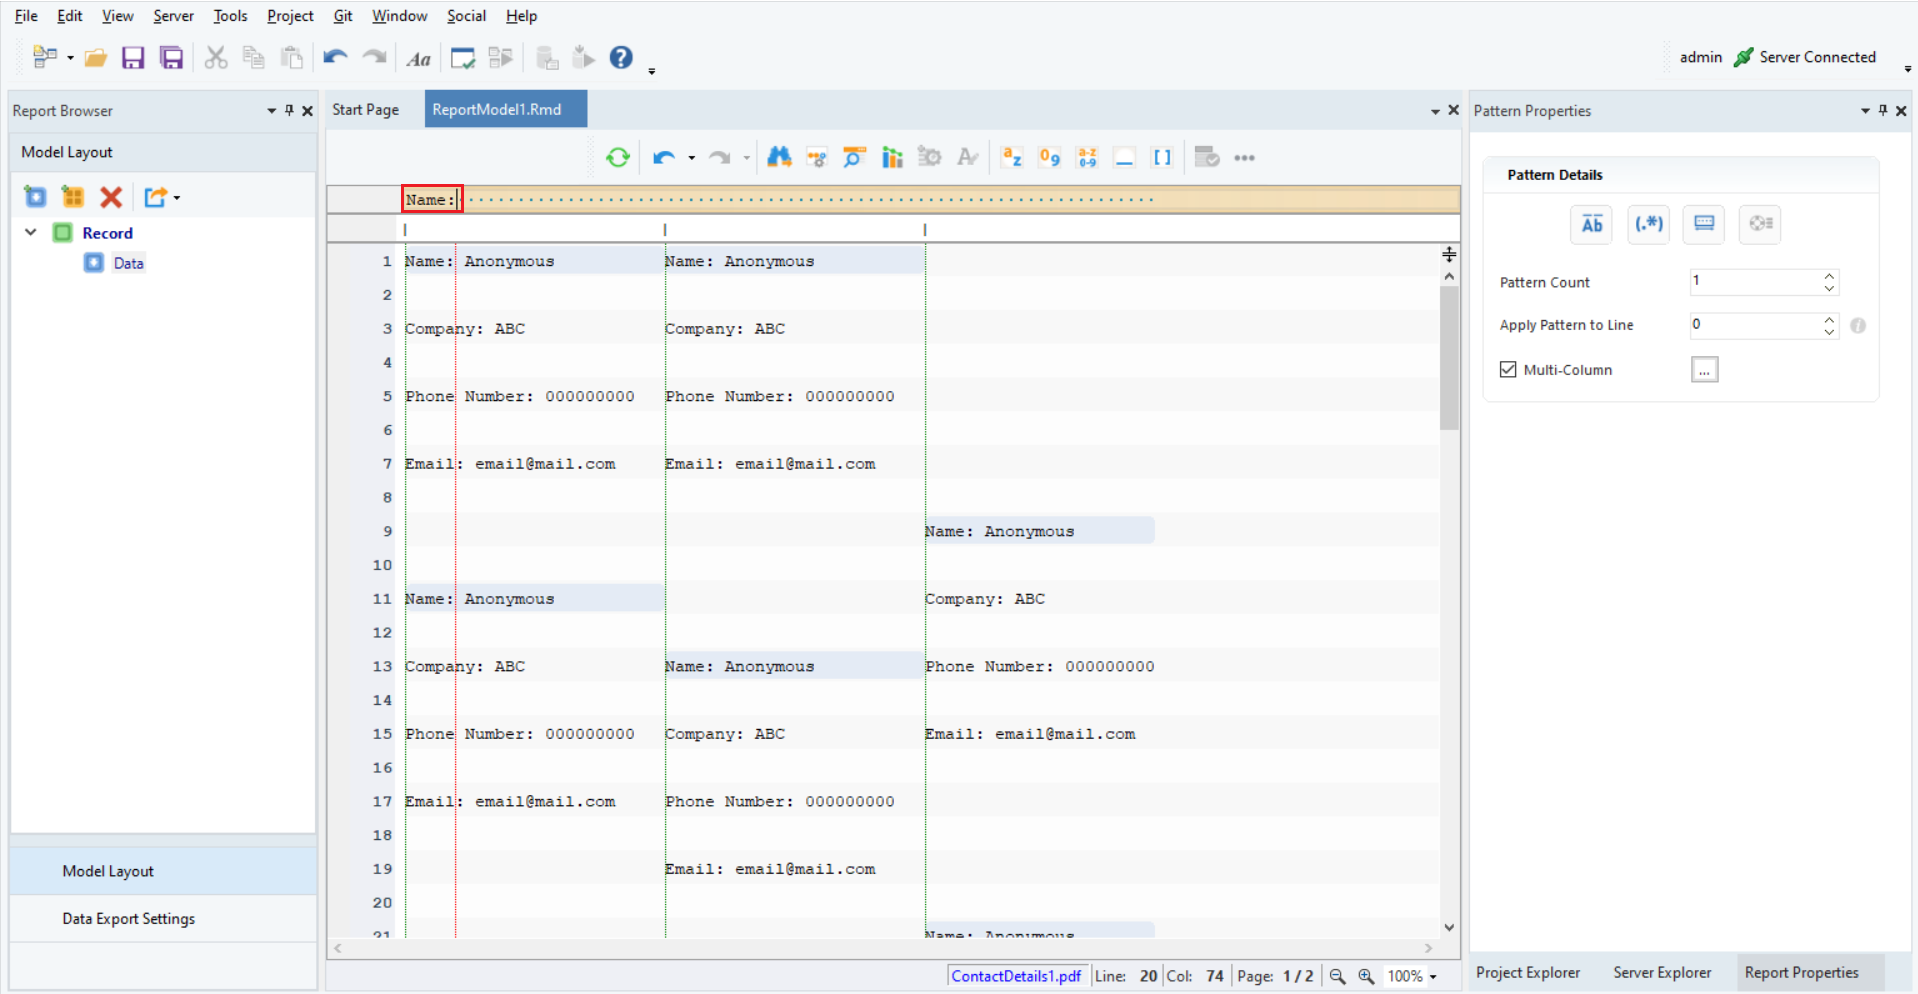
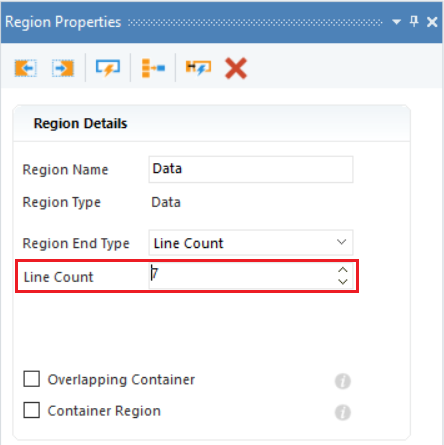
2. Increase the line count to 7 to capture all data fields.
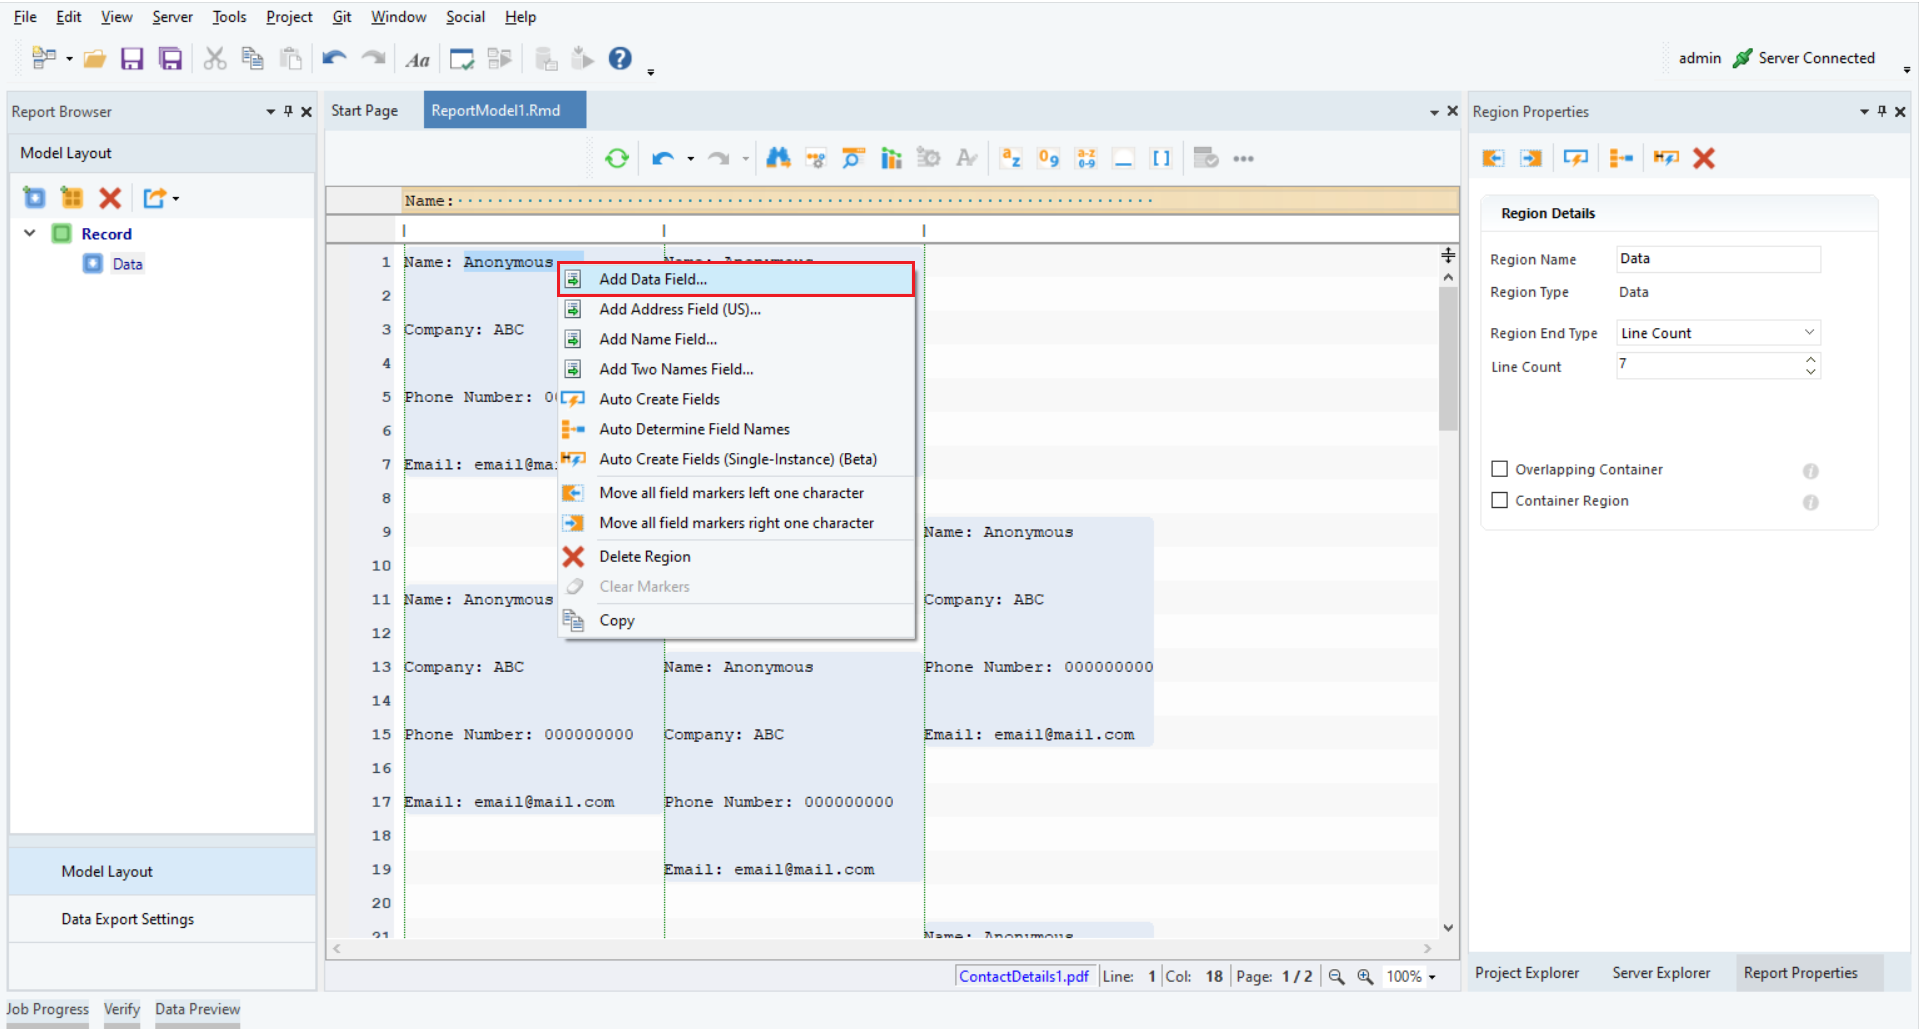
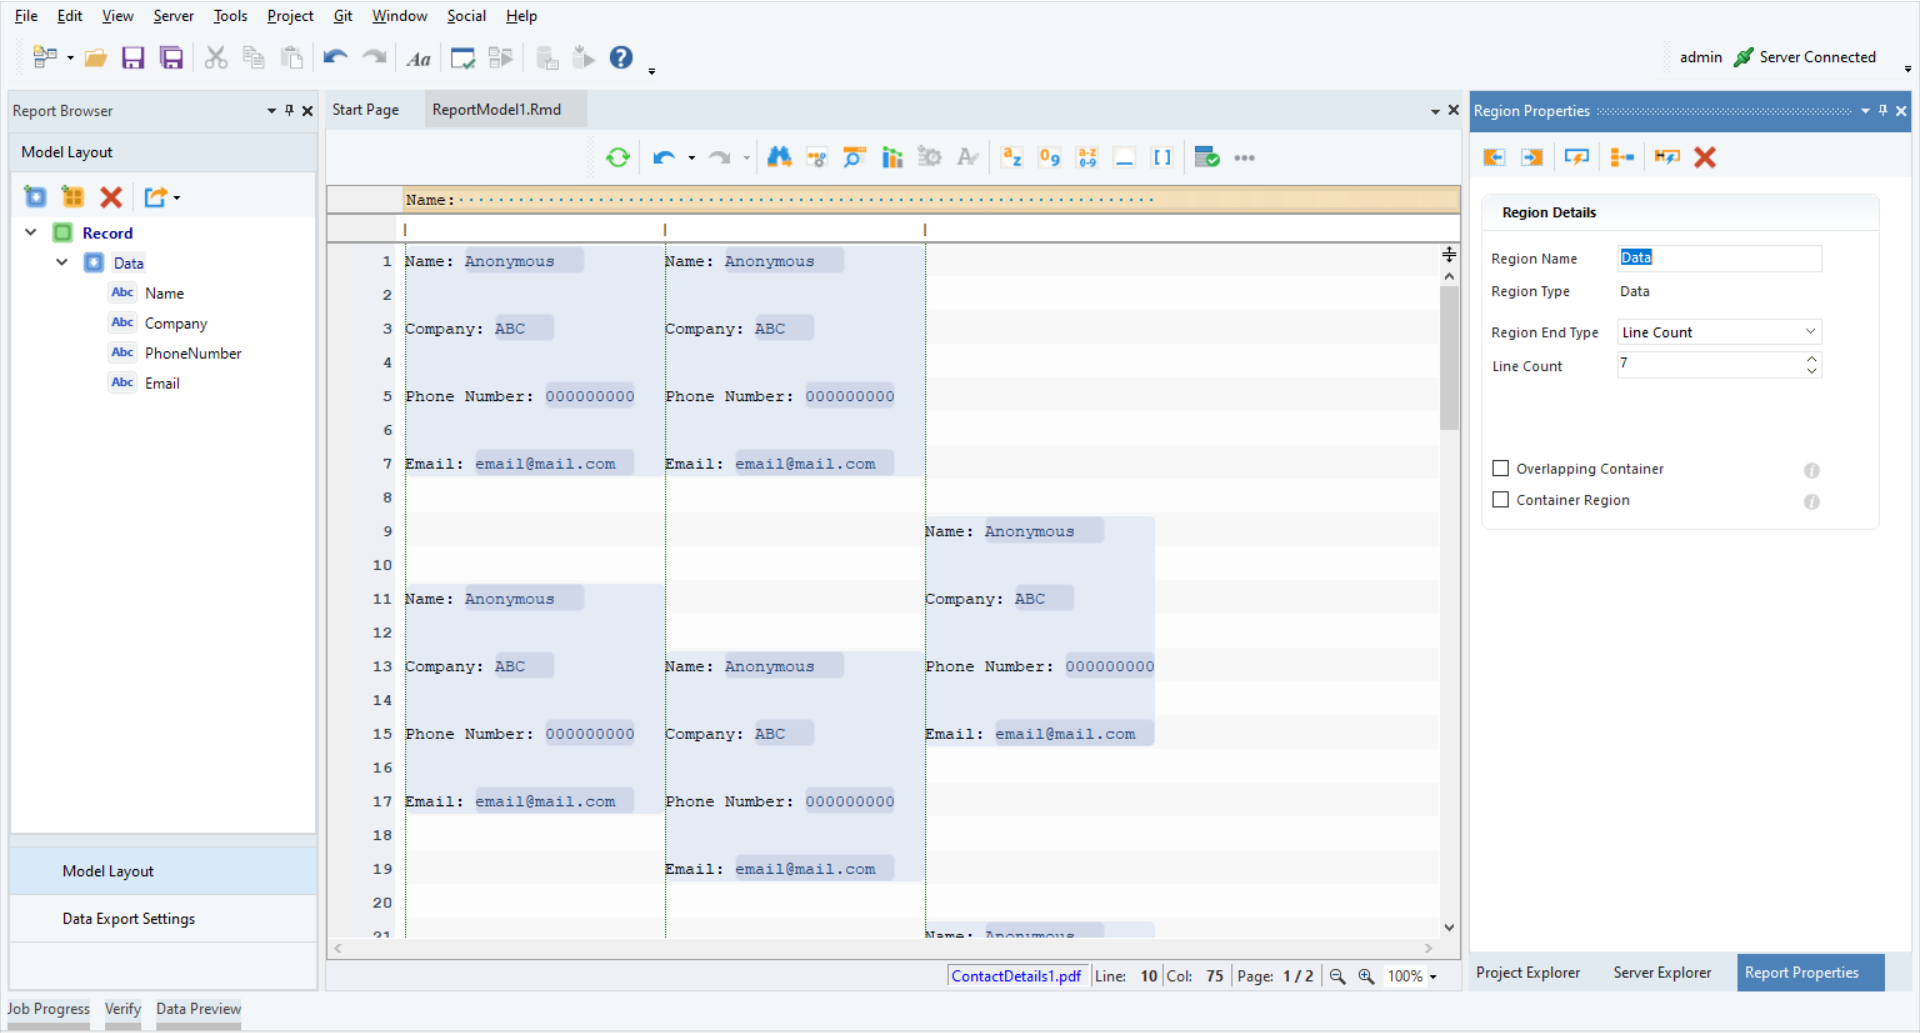
3. Highlight the data you want to capture in a field, right click on it and select Add Data Field. You will see that the data in the highlighted data region has been selected and a new field is added to your extraction template. Rename your field using the Name option in the Field Properties panel.
4. Repeat the steps for all the fields to build your extraction template.
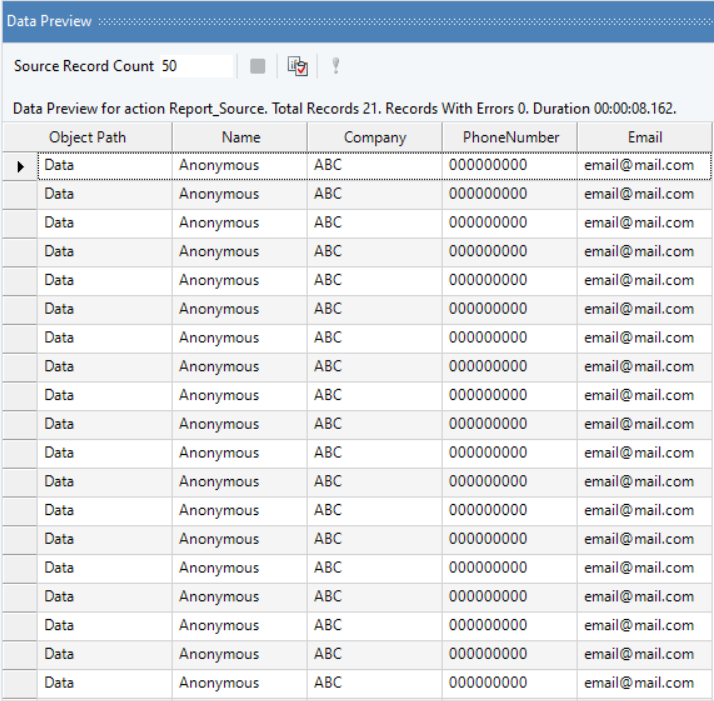
5. To preview your report model, click on the Preview Data option.

Your final output will look like this:
This concludes working with multi-column data regions in Astera ReportMiner.