Logging and Tracing
In Astera API Management, users can troubleshoot runtime issues by monitoring live tracing for any APIs deployed on the server.
To configure logging, create a new server profile by right-clicking on the cluster node in the Server Explorer and selecting Server Profiles from the context menu.
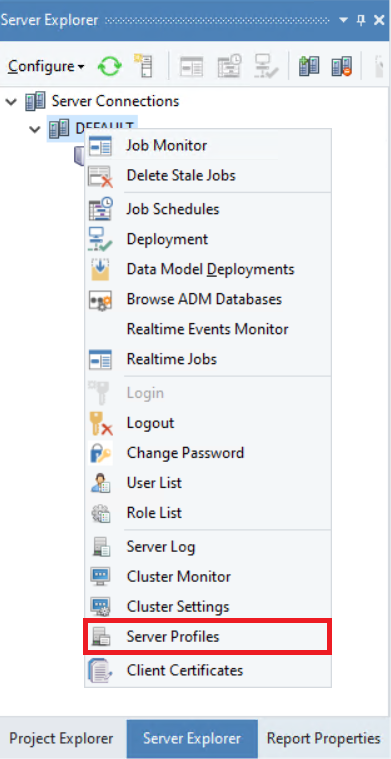
This will open a new window.
1. Create a new profile by selecting the Add a new server profile option.
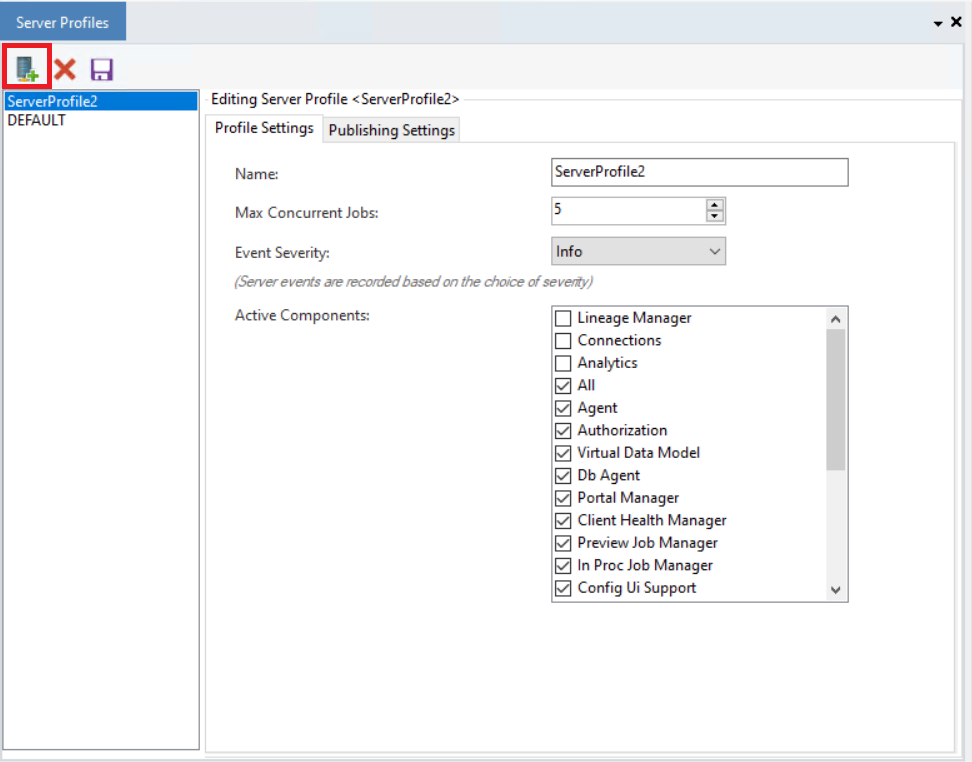
As you can see, we already have a server profile created.
2. Select the Publishing Settings tab and scroll down to the API Runtime logging and tracing section.
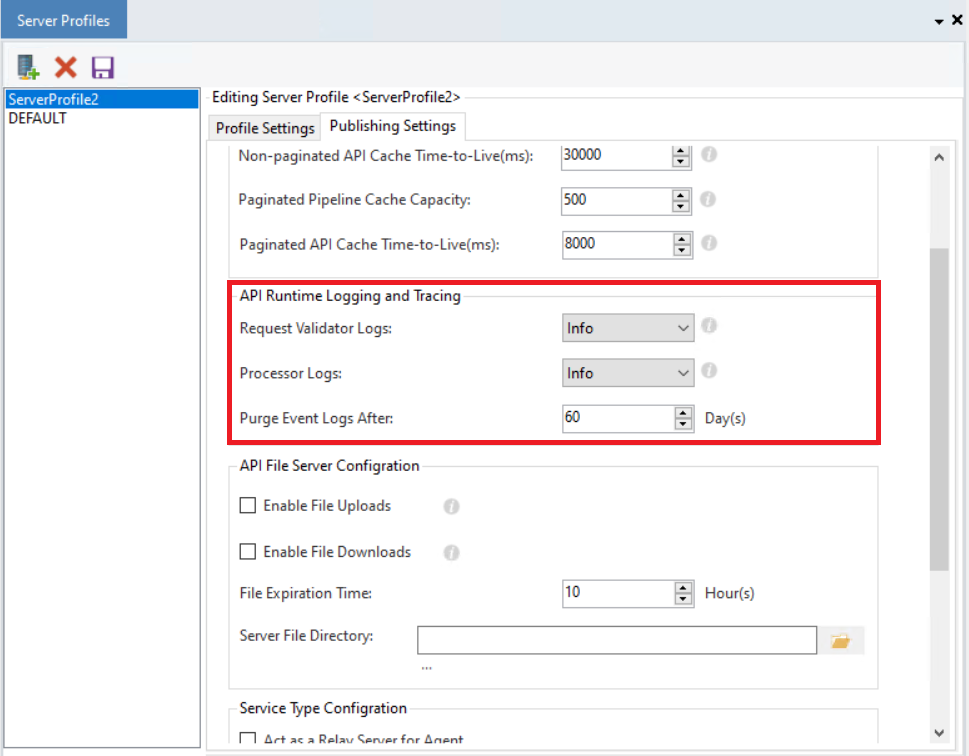
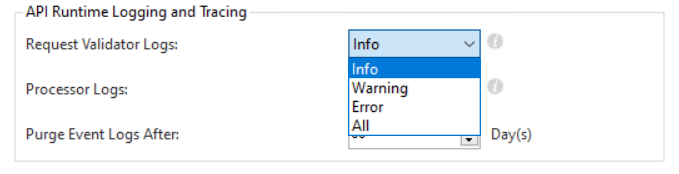
Here, the user can select the level of logs to be traced, including information, warnings, errors, or all-inclusive. The logging stages include,
Request Validator Logs: It includes pre-validating the request context before sending it through the runtime processor by validating the server availability, and deployment activity, and inspecting if the request has the supported formats.
Processor Logs: Processor logs include runtime components of the request, including information about a cached request pipeline, the concurrent pipelines in execution, and runtime capacity.
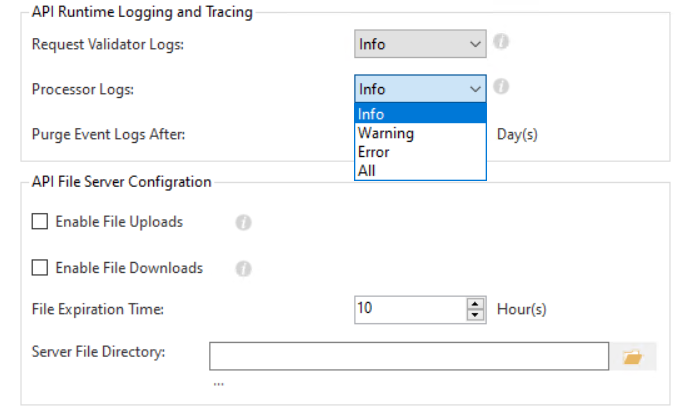
Purge Event Logs After: This counter shows the number of days after which the logs will be purged/removed since a lot of them can accumulate at runtime.
Once the server profile is configured and saved, the next step is to select this profile in the Server Properties.
After logging and tracing have been configured, users can now view the live runtime traces generated for all deployed APIs.
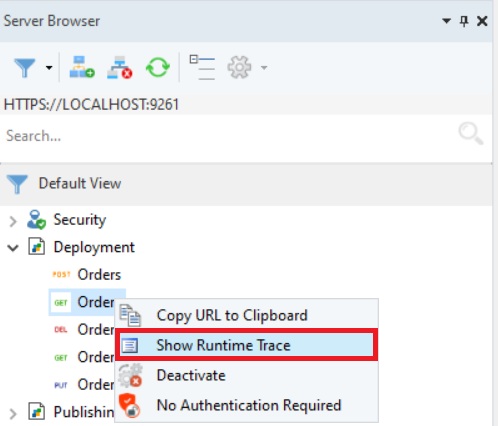
Next, go to the Server Browser and open the Deployed Endpoint View. To view the tracing for any deployed API, right-click and select Show Runtime Trace for any API deployment listed.
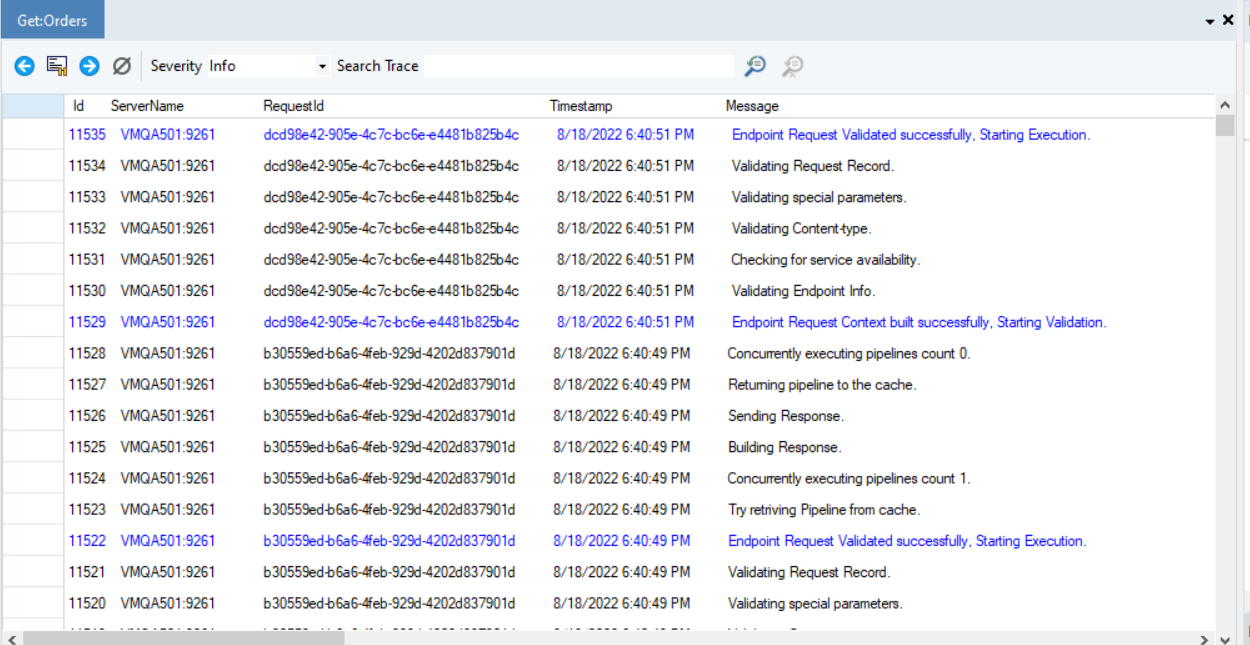
You can now see the trace.
This concludes logging and tracing in Astera API Management.