API Monitoring
Astera API Management lets users monitor live metrics for all deployed APIs using a Visualization Dashboard.
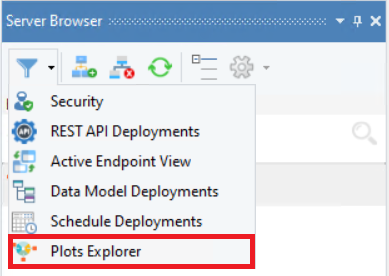
Select the Plots Explorer view in the Server Browser.
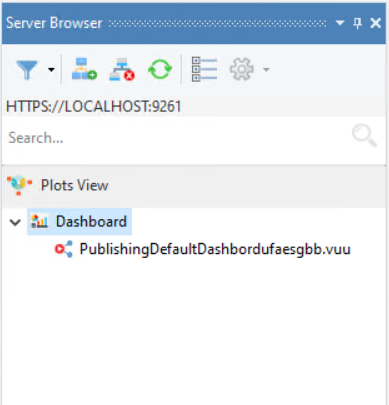
This will open a new view.
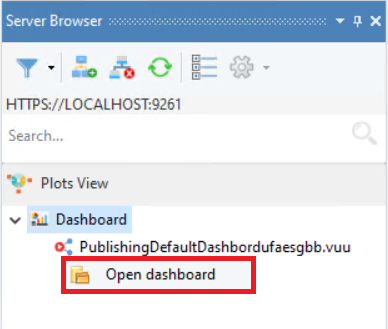
Right-click on the option present underneath the Dashboard node and select Open Dashboard from the context menu.
Selecting this will open the dashboard window.
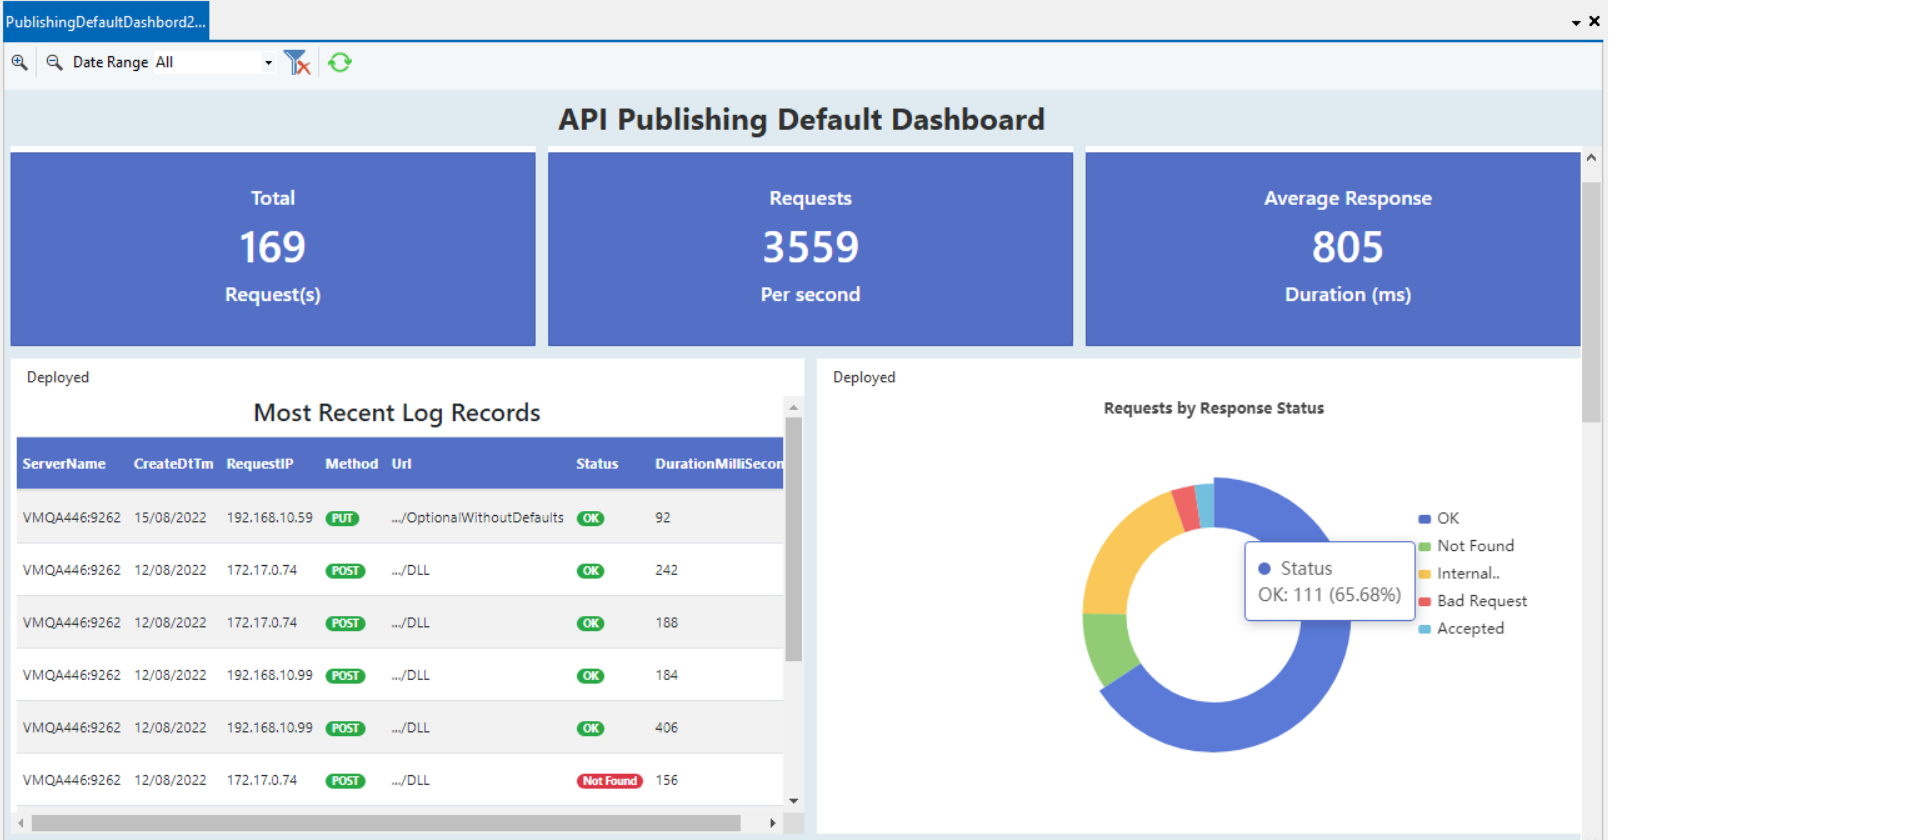
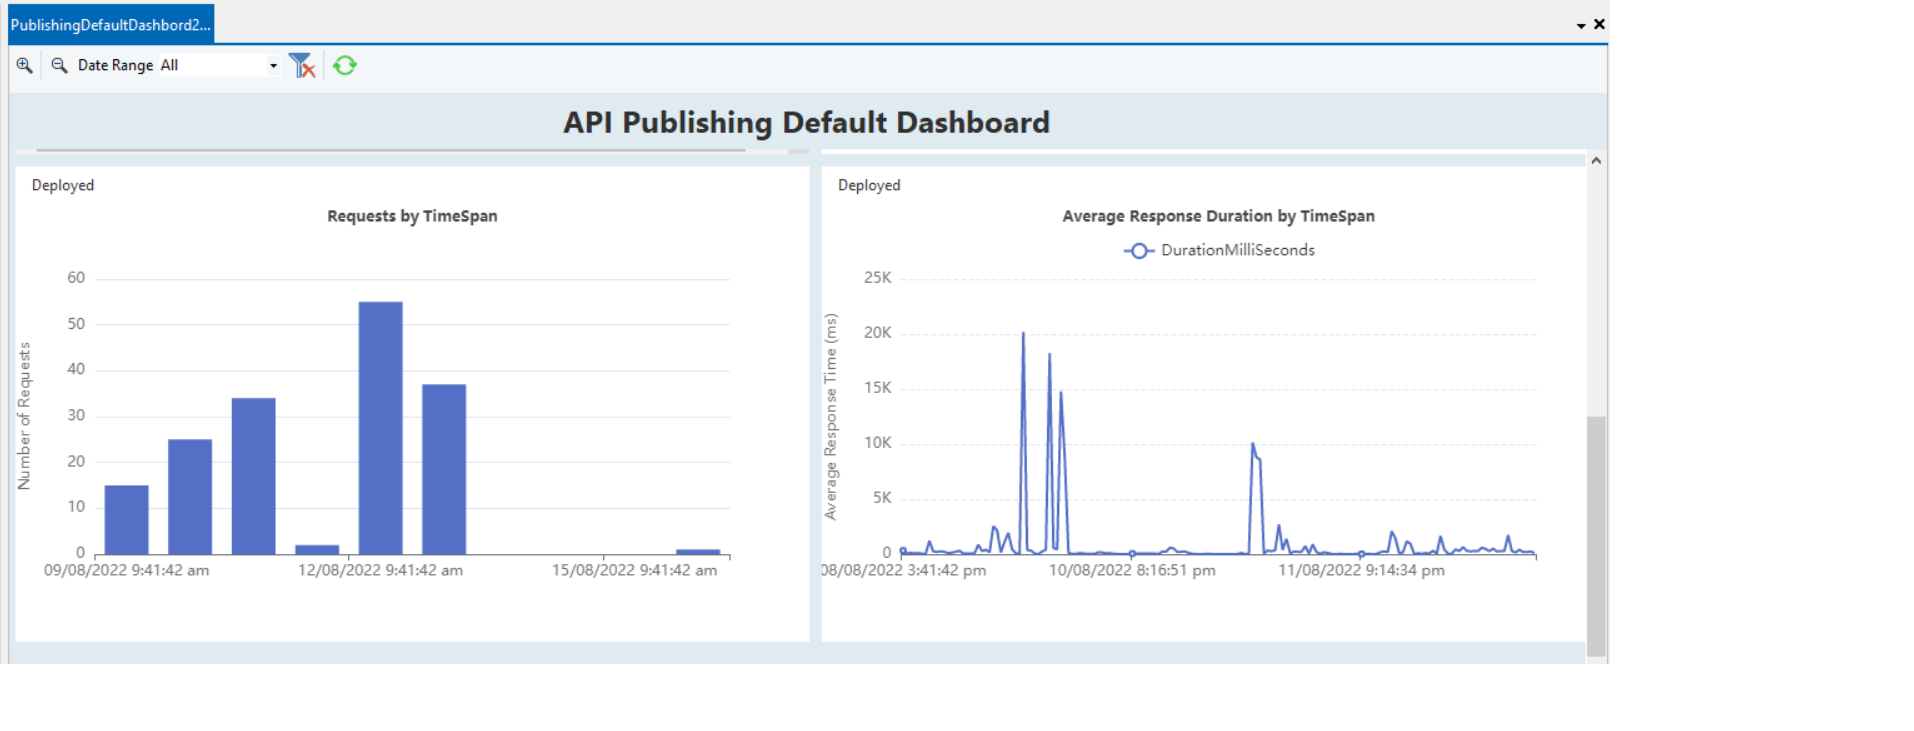
The dashboard shows various performance metrics and graphs which can be used to monitor the deployed APIs. These include,
Total number of requests
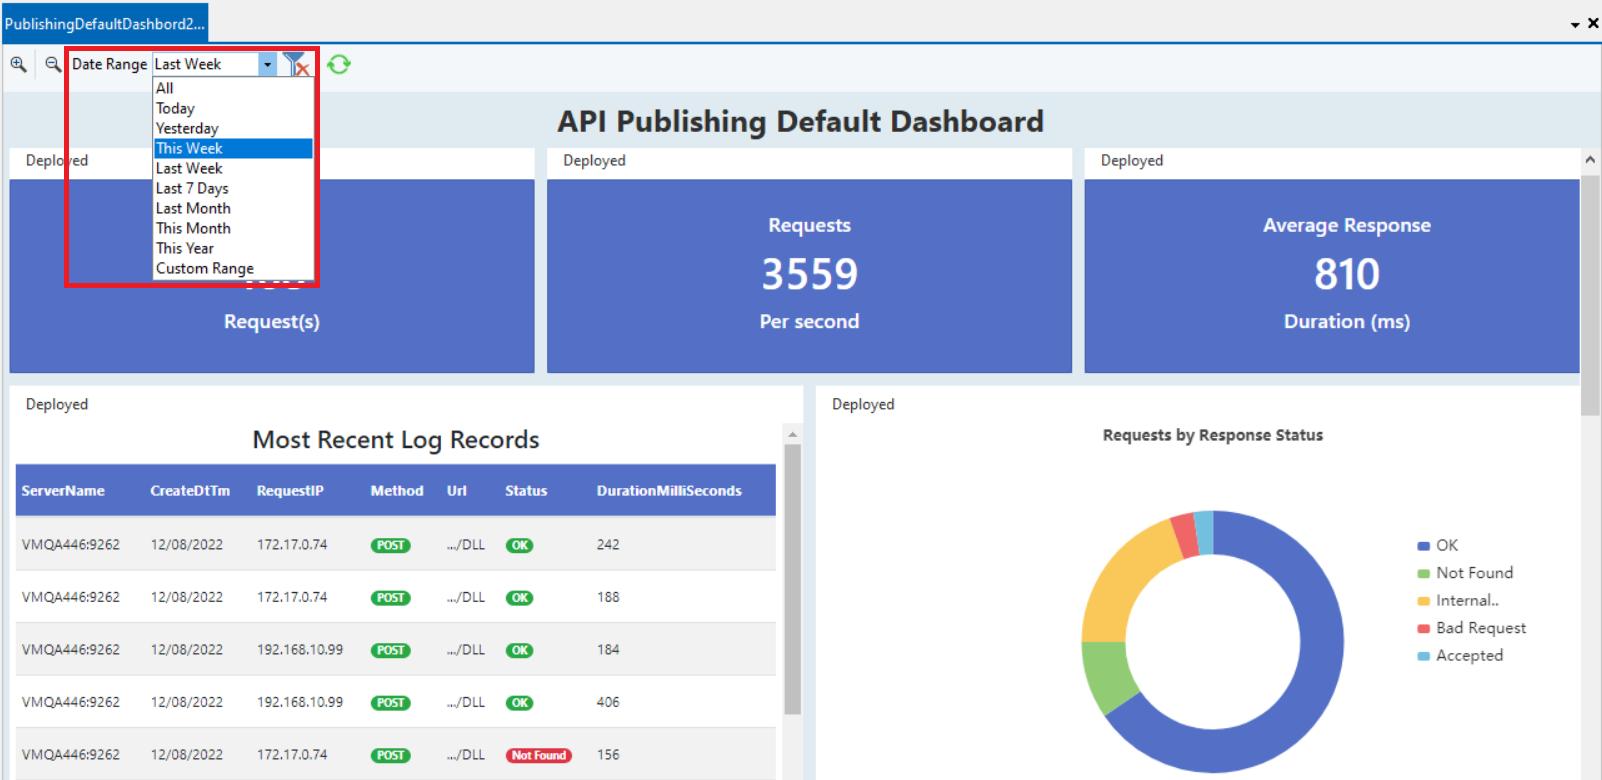
Requests per second - Measures the throughput of the API server, gauging the number of requests the server can handle in a time unit of a second.
Average response duration - This is a critical KPI that signifies the average time taken for an API to respond.
Most Recent Logs Record - Lists the 10 most recent requests catered along with detailed information about the server and client.
Requests by Response Status - This shows the percentage of each of the different responses for the deployed APIs.
Requests by Timespan - A bar graph that highlights the traffic received as per the number of requests received with time.
Average Response Duration by Timespan - A line graph showing the average response durations with time.
Using the Data Range filter, all these metrics and graphs can also be filtered by a data view.
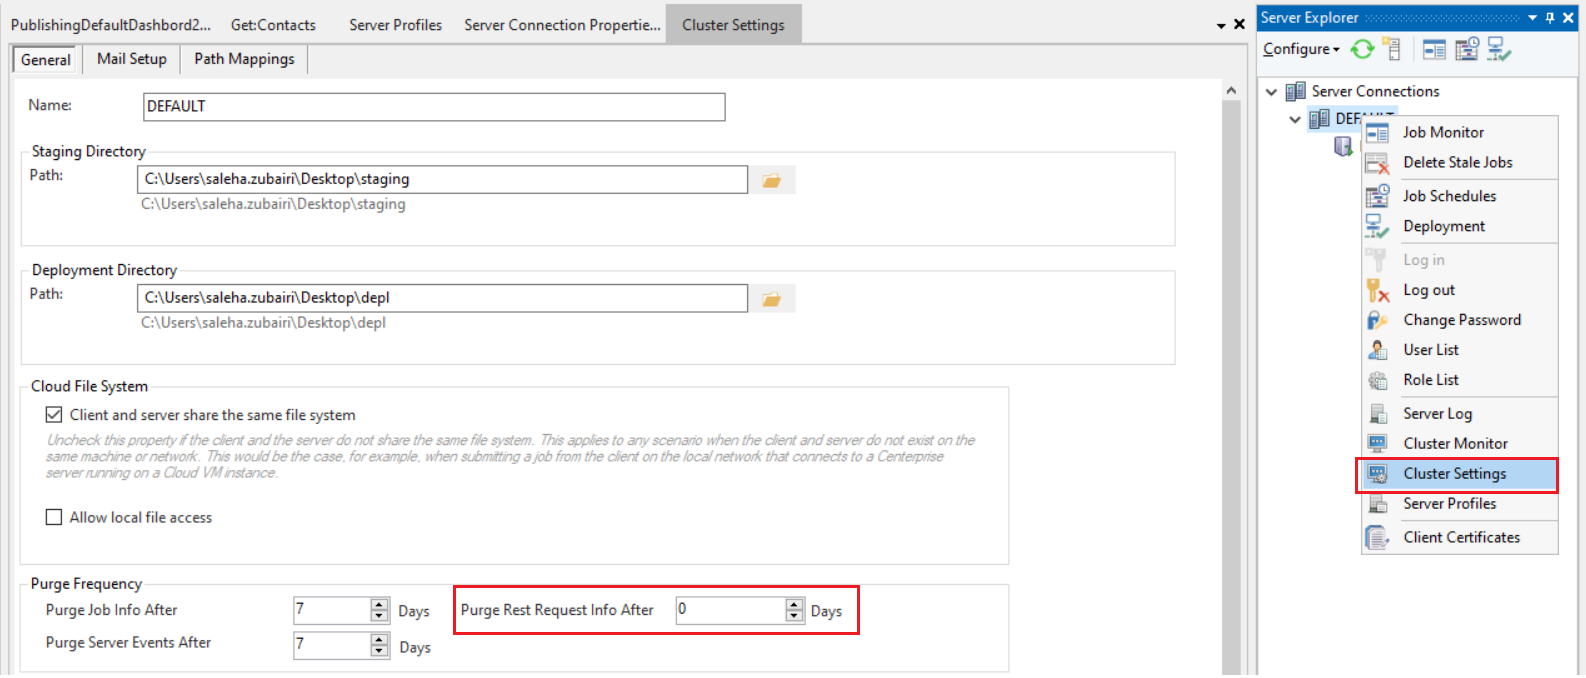
Note: The source table for the dashboard can be configured to purge.
From the Server Explorer, right-click on the cluster node and open Cluster Settings. Here, you can set the Purge REST Request Info After value to enable purging the source table.
A value of 0 signifies that the table would never be purged.
This concludes API Monitoring in Astera API Management.