ReportMiner Tutorial
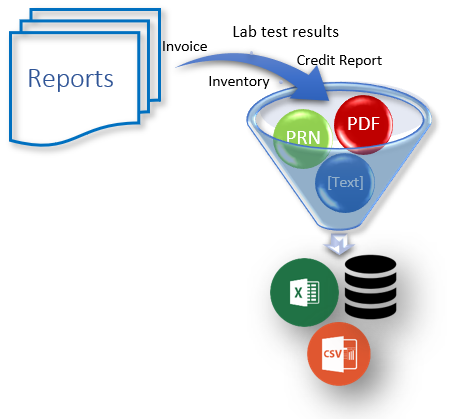
In this tutorial, we will explore the new and improved features of Astera ReportMiner. To extract data from a document, you need to create a report model, customize it using properties and multiple options available, and then select a destination of your choice to write the extracted data to, for instance, an Excel sheet or a database table.
Once you have designed a report model, test it by previewing the data and collecting statistical information.
The extracted data can be massaged further to conform to downstream needs, verified for quality, and sent to the destination of your choice. The created project can be deployed to automate the entire process of data extraction and data validation from documents that have a similar layout.
This tutorial will demonstrate how Astera ReportMiner creates and automates the data extraction process and expedites data preparation with features such as Data Exporting, Workflow Orchestration, Email/FTP/Folder Integration, Data Verification and Scheduling Extraction.
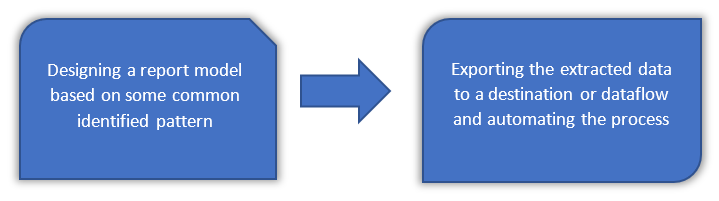
The process involves two important steps as shown in the figure below:
What is a Report Model?
Astera ReportMiner uses a template-based extraction model to extract data from unstructured file sources. The template is to be designed by the users that directs and guides the data extraction process by Astera ReportMiner. We refer to this template as a Report Model or an Extraction Template. We will continue to use these terms throughout this tutorial.
In the next section, we will discuss about the anatomy of a report model.
Anatomy of a Report Model
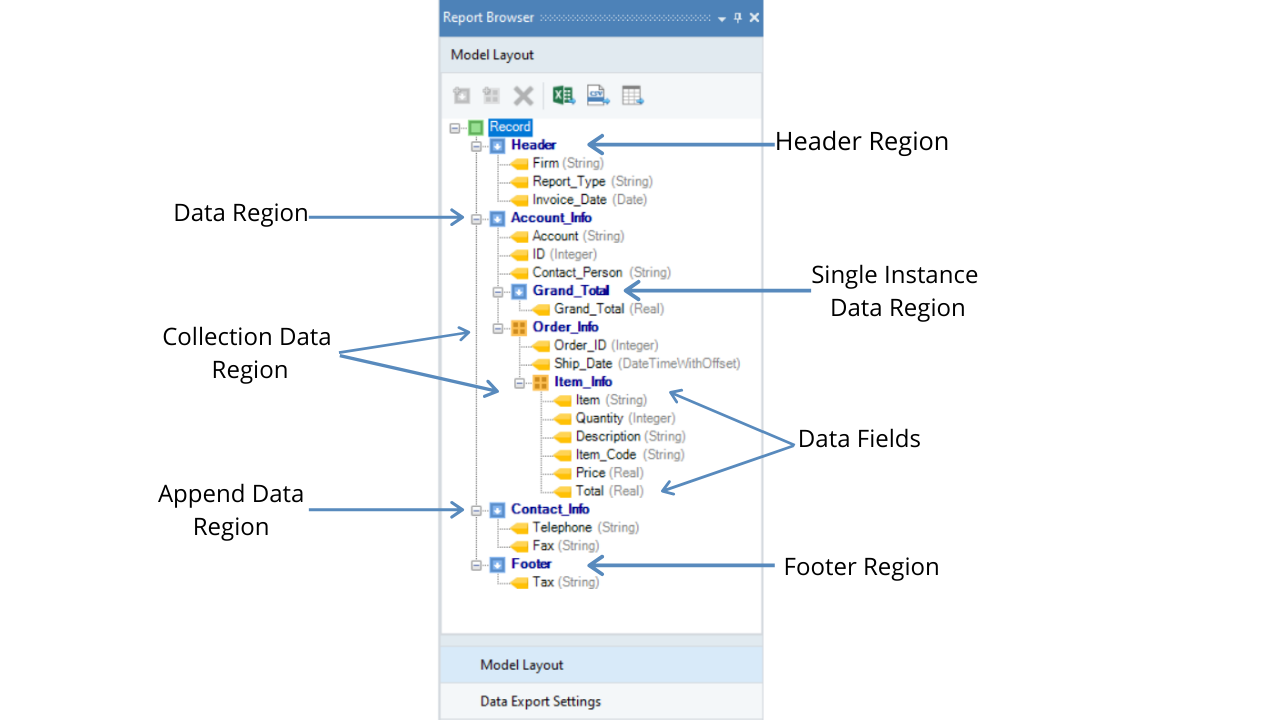
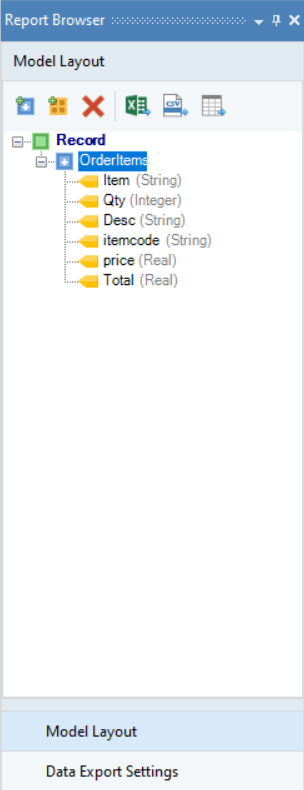
A report model comprises of seven main components that appear in the Model Layout tab as shown below:
A brief description for each of these components is given in the table below:
| Feature | Description |
|---|---|
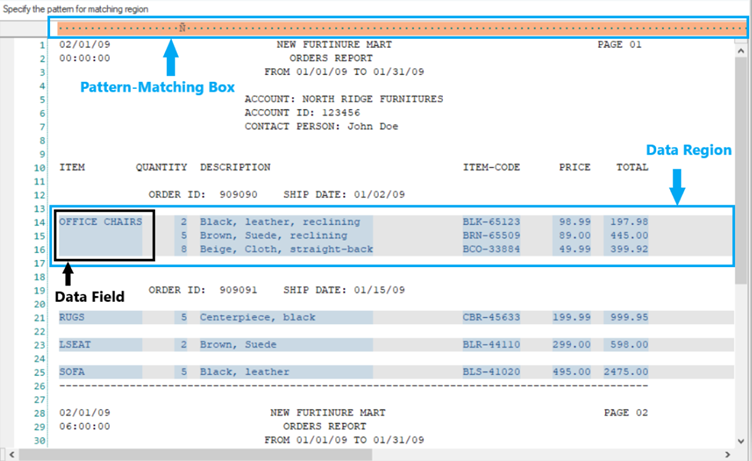
| Data Region | It is a section (in an unstructured file) that contains desired data points which are to be extracted. The data region can cover any number of lines in a source report and is specified by repeating pattern(s). |
| Header and Footer Regions | The data region at the top/bottom of a page is referred to as the header/footer region respectively. Add these regions if you are trying to extract information that is repeating on each page in the header/footer sections. |
| Single Instance Data Region | It is a sub-region that extracts a single set of data points within a data region. In the data preview, it is shown as a single record. |
| Collection Data Region | It is a sub-region that extracts multiple sets of data points within a data region. It is a collection of records captured in a hierarchical structure. For example, a collection of product items under a single Order ID. |
| Append Data Region | It is a region that you can add as part of a report model that would otherwise be left out of a data region. |
| Data Fields | It is the area within a data region containing the information that is to be extracted. |
Astera ReportMiner’s Interface
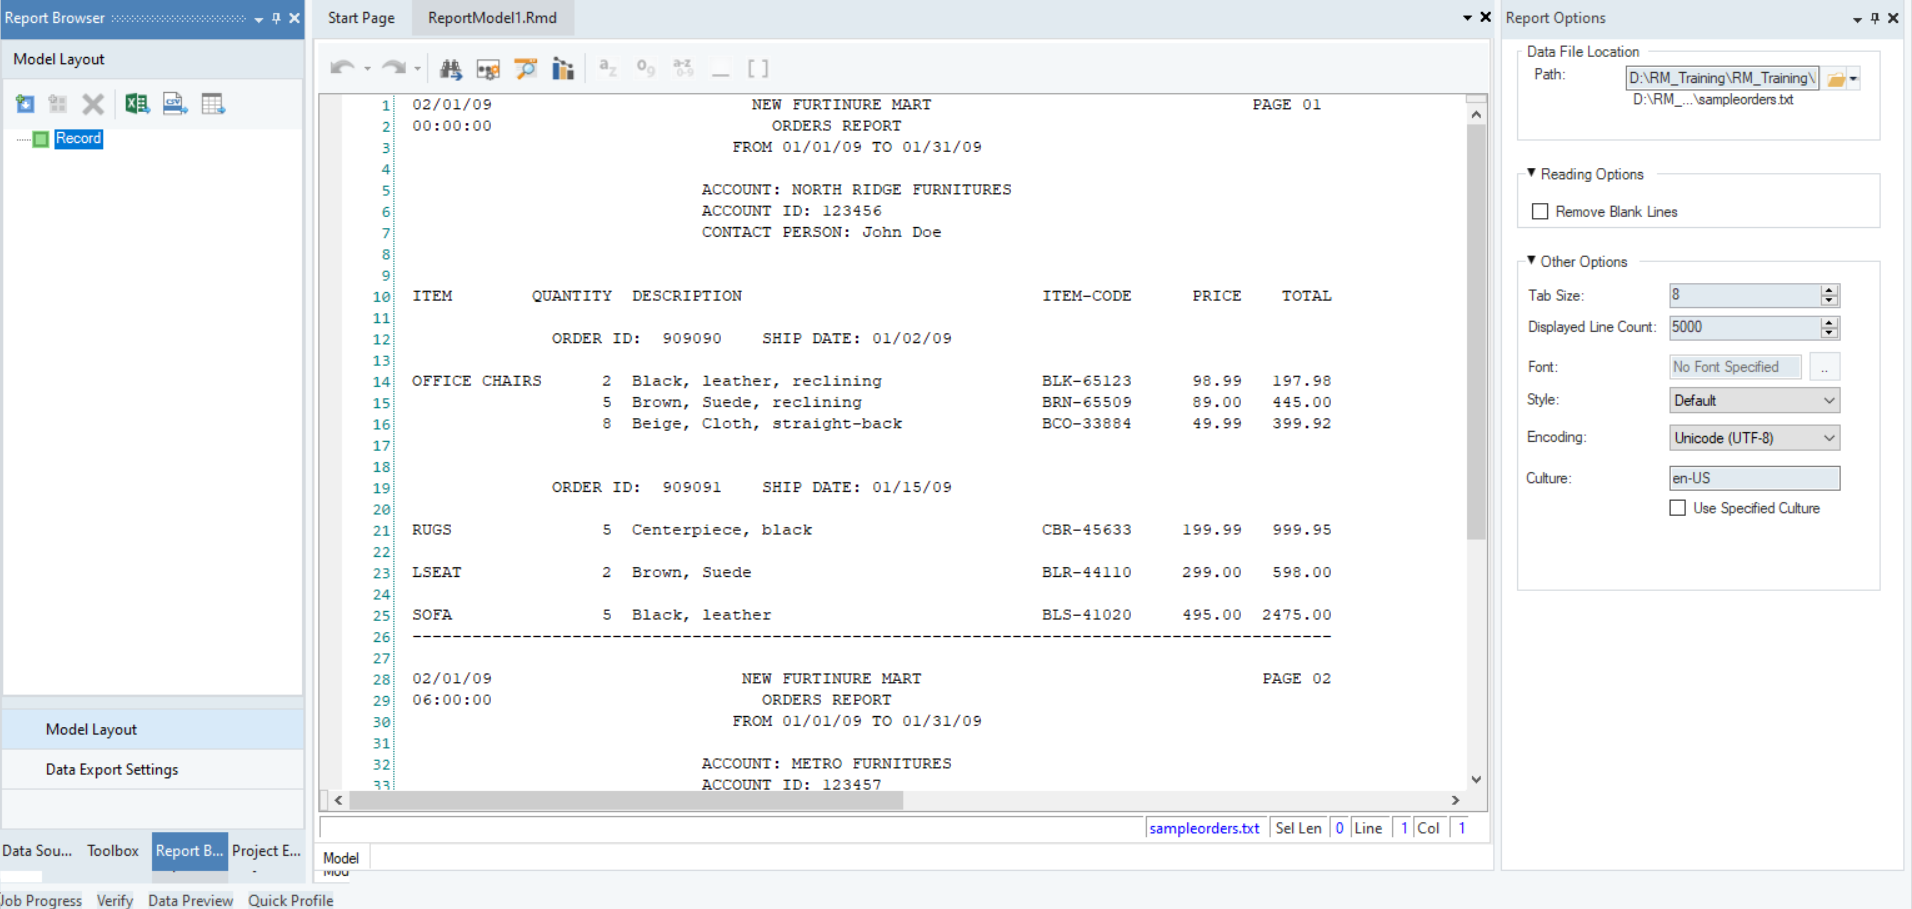
Astera ReportMiner’s user-friendly interface enables business users to easily accomplish a wide range of data extraction tasks without relying on or employing expensive IT resources. With its easy-to-use, visual interface, the tool walks you through the process of identifying your desired data points, building the extraction logic, and sending it to the destination of your choice. The screenshot below displays important panels/windows in Astera ReportMiner.
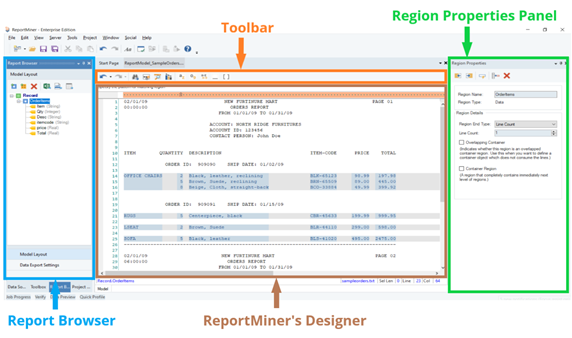
The windows and panels shown in the screenshot above are discussed in the subsequent sections.
ReportMiner’s Designer
The unstructured file is loaded onto the ReportMiner’s designer where data regions are defined by identifying and specifying repeated patterns in the source report. Data fields are then captured from the defined data regions.
Pattern Box
ReportMiner extracts data based on the repeatedly appearing patterns in the source report. You have to identify and specify those repeating patterns in a report model to create data regions.
You have to write the pattern in the Pattern Box (the orange region in the screenshot) to define a data region. A pattern can be any combination of alphabets, words, numeric, or alphanumeric characters. Astera ReportMiner has built-in wild cards to define patterns.
Sometimes a single pattern cannot cover and define a data region. In such a case, you can make use of multiple patterns together to define the extraction logic.
Note: ReportMiner supports a maximum of five different patterns for a single data/collection region in a report model.
Toolbar
The toolbar has various options that facilitate the data extraction process. The purpose and functionality of the icons present in the toolbar are discussed below:
![]()
Report Browser
Report Browser contains features and layout panels for building extraction models and exporting extracted data.
There are two main tabs in a Report Browser panel:
Model Layout
Model layout tab displays the layout of your report model or extraction template. It contains data regions and fields built according to a custom extraction logic.
You can add and delete regions and fields, edit their properties, and export data directly to an Excel sheet, a CSV file, or a database table using the options available in this window.
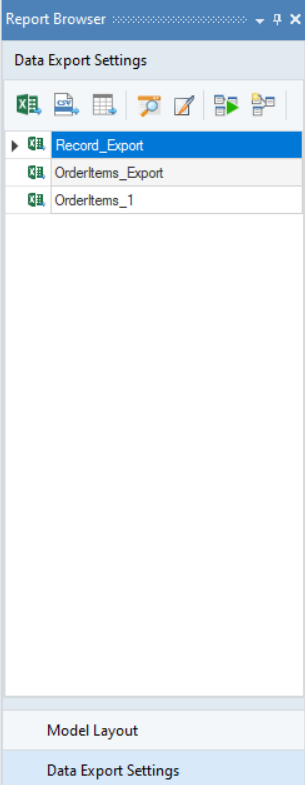
Data Export Settings
Extracted data can be directly exported to an Excel sheet, a delimited file, or to a database table such as Microsoft SQL Server, Access, PostgreSQL, MySQL, or ODBC.
This exported data can then be used in various flow documents (a dataflow, a workflow, or a subflow).
For more information on Report Browser, refer to this article.
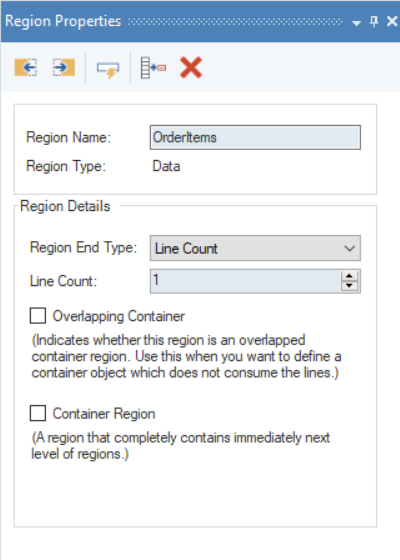
Region Properties Panel
- Region Name – allows you to change the name of the data region.
- Region Type – tells the type of your region.
Region Details
- The Region Details section lets you further customize your data region.
- Region End Type – with the options available in the Region End Type drop-down list, you can specify where you want to end your data region. The options available are as follow:
- Line Count – ends your region after a specified number of lines.
- Blank Line – ends your region every time a blank line occurs.
- Last Fields – ends your region at the last data field within your data region.
- Another Region Starts (100 Rows Max) – ends your first data region where the next data region begins. This is used for variable-length data regions.
- Line Count – allows the user to vary the line count according to the requirement of the data region.
- Overlapping Container – used when there are multiple data regions with overlapping lines.
- Container Region – used when a data region contains a sub-region within its boundaries.
For more information on Region Properties panel, refer to this article over here.
Pattern Properties Panel
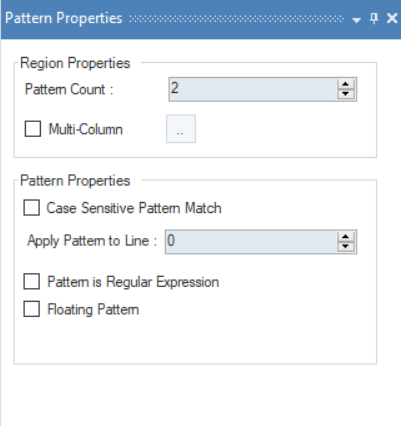
Let’s discuss the options available on this panel:
Region Properties
- Pattern Count - this option helps you increase the pattern count.
- Multi-Column - this option is used when you have data residing in multiple columns.
Pattern Properties
- Case Sensitive Pattern Match – this option matches the data on a case-sensitive basis. For example, ‘Account’ and ‘account’” will be treated as two different patterns by ReportMiner if the checkbox is enabled for Case Sensitive Pattern Match.
- Apply Pattern to Line – this option is useful when the specified pattern does not capture the first line of the desired data region. For instance, when there is some information above the pattern keyword, then we increase Apply Pattern to Line from 0.
- Pattern is a Regular Expression – when this option is checked, ReportMiner reads the specified pattern as a regular expression. A regular expression is a special text string used to describe a search pattern. You can think of regular expressions as wildcards. For example, wildcard notations such as *.txt is used to find all text files in a file manager.
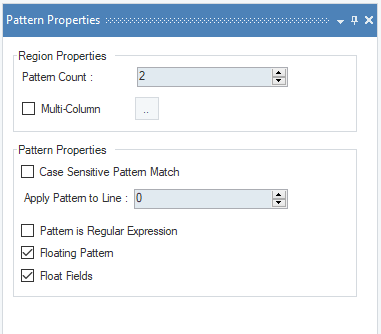
- Floating Pattern – the Floating Pattern option within the report model component allows you to capture each data field that matches the specified pattern no matter where it is located on the report model’s designer.
- Float Fields – the Float Fields option will automatically appear to the right of the Floating Pattern option when it is checked. The Float Fields option ensures that the line spacing also floats and is based on the line used to capture the first field. This option is checked by default but can also be unchecked if you’d like the field position remain fixed.
For more information on Pattern Properties panel, refer to this article.
Field Properties Panel
This panel appears when you define a data field within a data region.
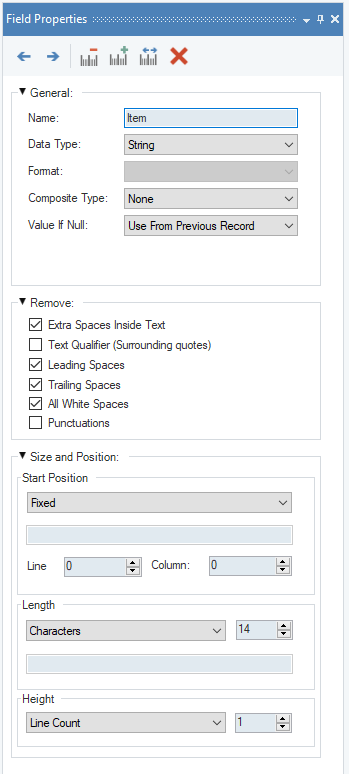
The Field Properties panel allows users to customize the defined fields with the help of the following options:
General
- Field Name – allows users to assign a name to a data field.
- Data Type – provides option to set the data type to string, real, date etc.
- Composite Type – resolves a composite field such as full address or full name into components.
- Format – allows users to change the format of a date field.
- Value If Null – performs actions in cases where the field value is null.
- None: This is the default setting. If ‘None’ is selected, the field will remain the same. For example, if the field in question is an empty address field, the cell will be displayed as empty in the preview.
- Apply specified default: A string can be typed in for use here, such as ‘N/A.’ When the program finds a null value, the specified value will appear in the previewed cell instead of an empty cell.
- Use from previous record: This returns the value of the preceding record in the same field.
Remove
- Extra Spaces Inside Text - allows users to remove blank spaces inside the source unstructured file.
- Text Qualifier (Surrounding quotes) - allows users to remove quotation marks from the extracted data.
- Leading Spaces - allows users to remove all blank spaces till first non-black character appears.
- Trailing Spaces - allows users to remove all blank spaces after last non-black character.
- All White Spaces – removes all the white spaces from a data field.
- Punctuations – removes all the punctuations from a data field.
Size and Position
Here, you can specify the size and position of a data field.
- Start Position - allows users to manually specify the start position of a data field.
- Line/Column - allows users to define co-ordinates to specify the starting position of the data field.
- Length - allows users to set the length of a data field.
For more information on Field Properties panel, refer to this article over here.
Working With Astera ReportMiner
Astera’s ReportMiner provides a complete solution for automated extraction of data. Its user-friendly interface enables business users with little or no programming knowledge to easily accomplish a wide range of data extraction tasks without employing expensive IT resources.
In the following sections, we will learn how to built an extraction template, verify it against a sample data and export it to dedicated destination.
Creating a Report Model
Step 1: Loading Unstructured File
- Open a Report Model in ReportMiner by going to File > New > Report Model.
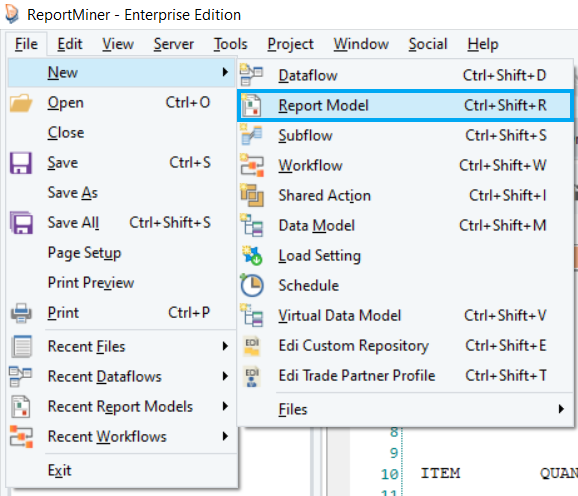
- Provide the File Path for the unstructured file from you local or shared directory.
- Click OK. The text file containing Orders invoice data will display on report model’s designer.
ReportMiner will use this file to create a report model. ReportMiner supports extraction of unstructured data from text, Excel, RTF, PRN, EDI, or PDF files.
There are many options available on the Report Options panel to configure how you want ReportMiner to read your file. The reading options depend on the file type and content type of your data. For example, if you have a PDF file, you can specify the scaling factor, font, tab size, and passwords.
You can read more about these options here.
In this example, we are extracting Orders invoice data from a text file.
Step 2: Creating a Report Model
1. Header Region
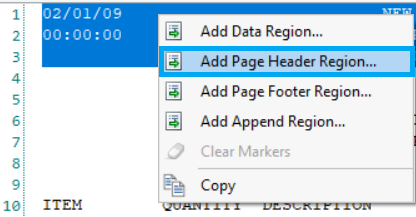
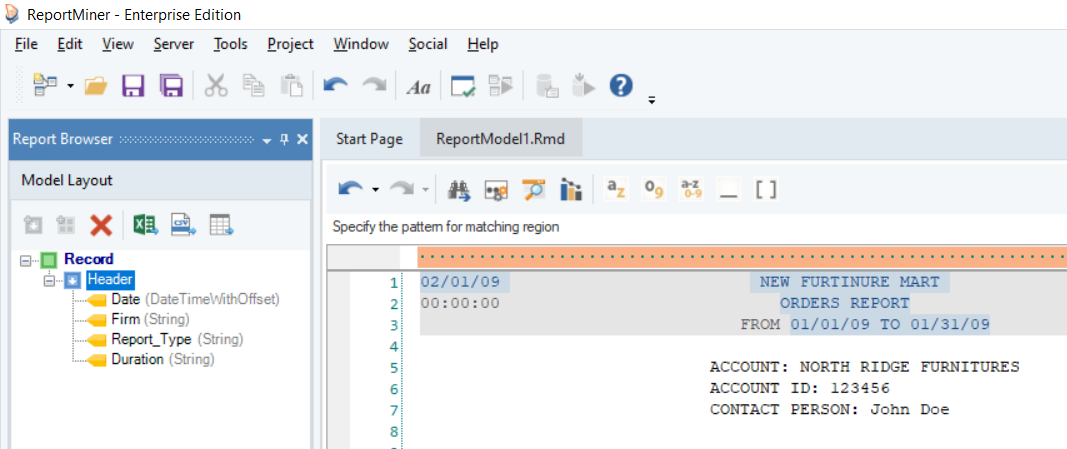
Let’s take a look at the report document we have opened in the report model editor. At the top of the document is some general information, including company name and report dates. Then we have some account information, followed by order information including individual order items. Notice that this document also has a repeating header on each page. To extract the data from the header, we will need to add a Header to our report model.
- Highlight the top region, right-click on it and select Add Page Header Region… from the context menu.
This area will now be highlighted in grey and the header region will show up in the Model Layout tab.
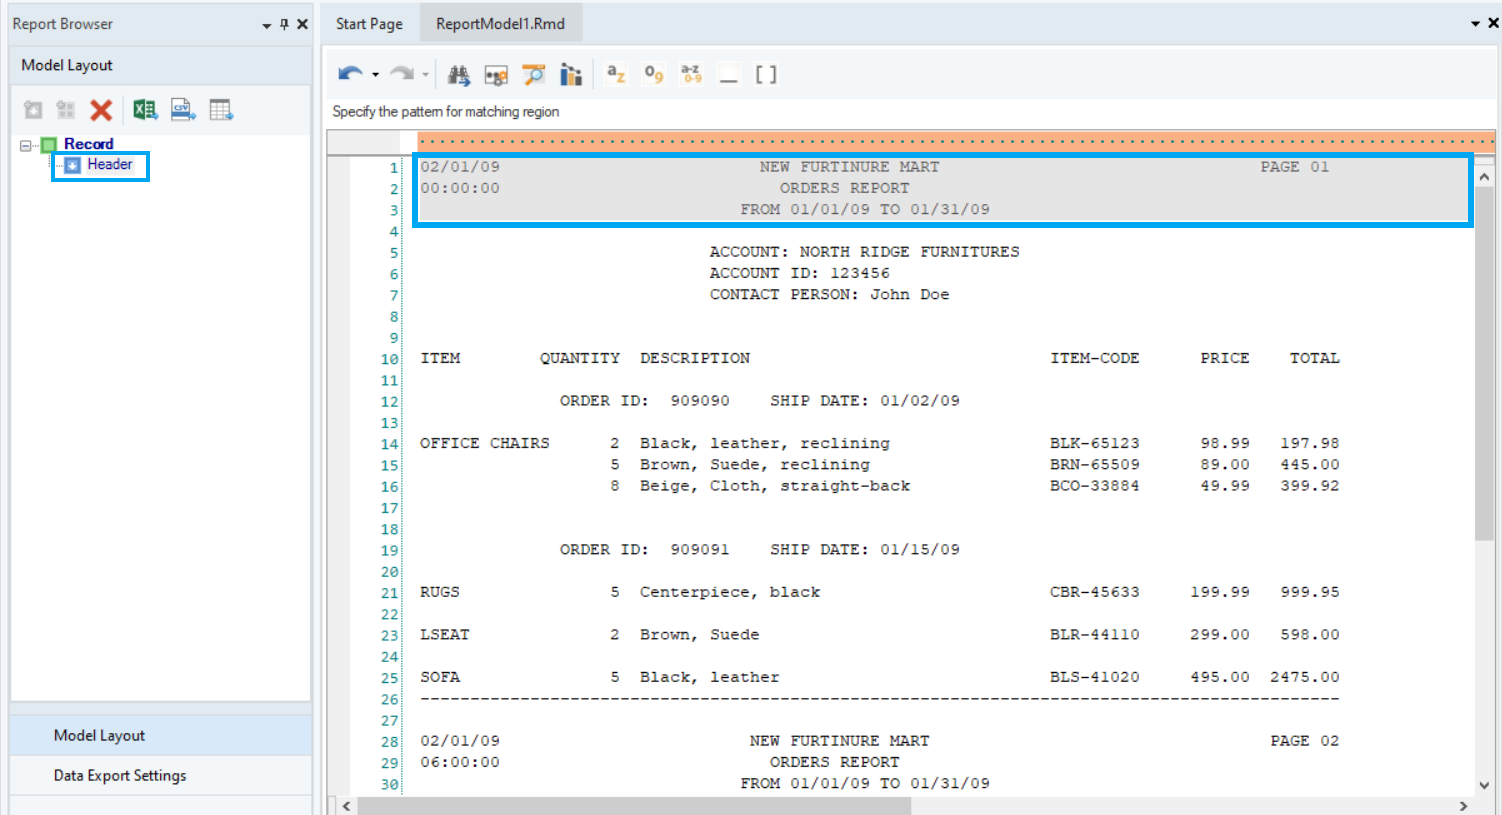
Note: It is important to note that the header is only required in documents that have identical text at the top of each page – for example, report title, date, etc. Hence, it is not mandatory to have a header in all report models.
Next step is to create data fields that make up the header.
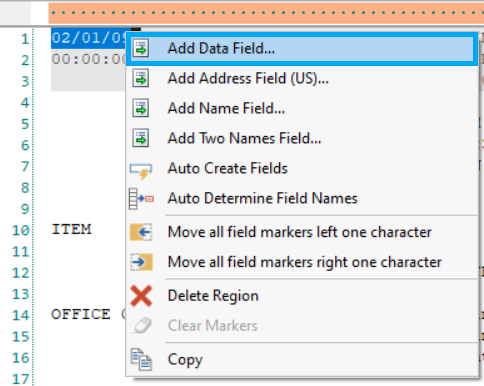
- Highlight the field area, right-click on it and select Add Data Field… from the context menu.
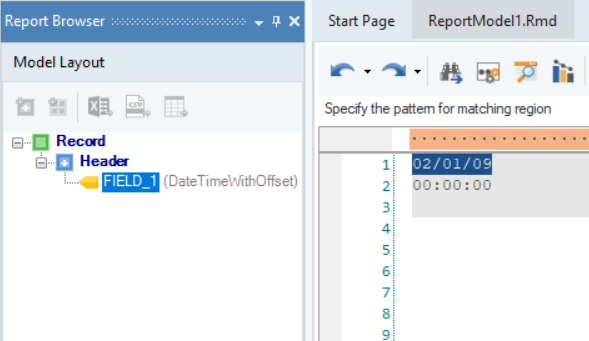
A data field will be added to the report model.
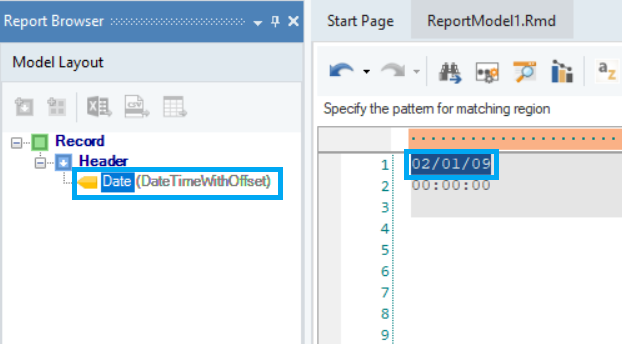
Rename the data field from the Field Properties panel.
Repeat the process to create more data fields and name them, as shown below. You can now see the layout of the report model in the Model Layout tab.
The header region has been created for this report, so let’s move on to creating a data region.
2. Data Region
- Right-click on the Record node, inside the Model Layout tab, and select Add Data Region from the context menu.
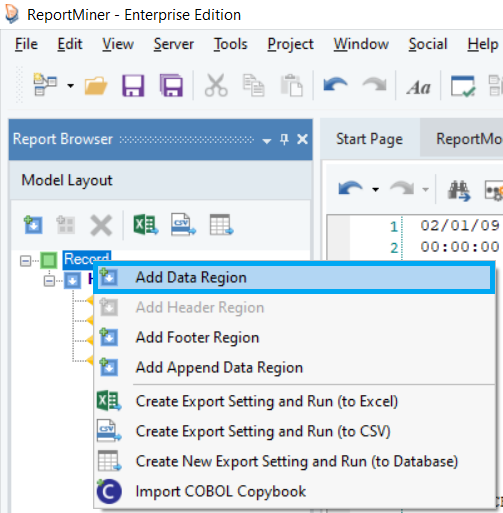
A Data node will be added to the report model, appearing in the Model Layout tab.
Further notice that a pattern-matching box and Region Properties panel appear on the report model designer window.
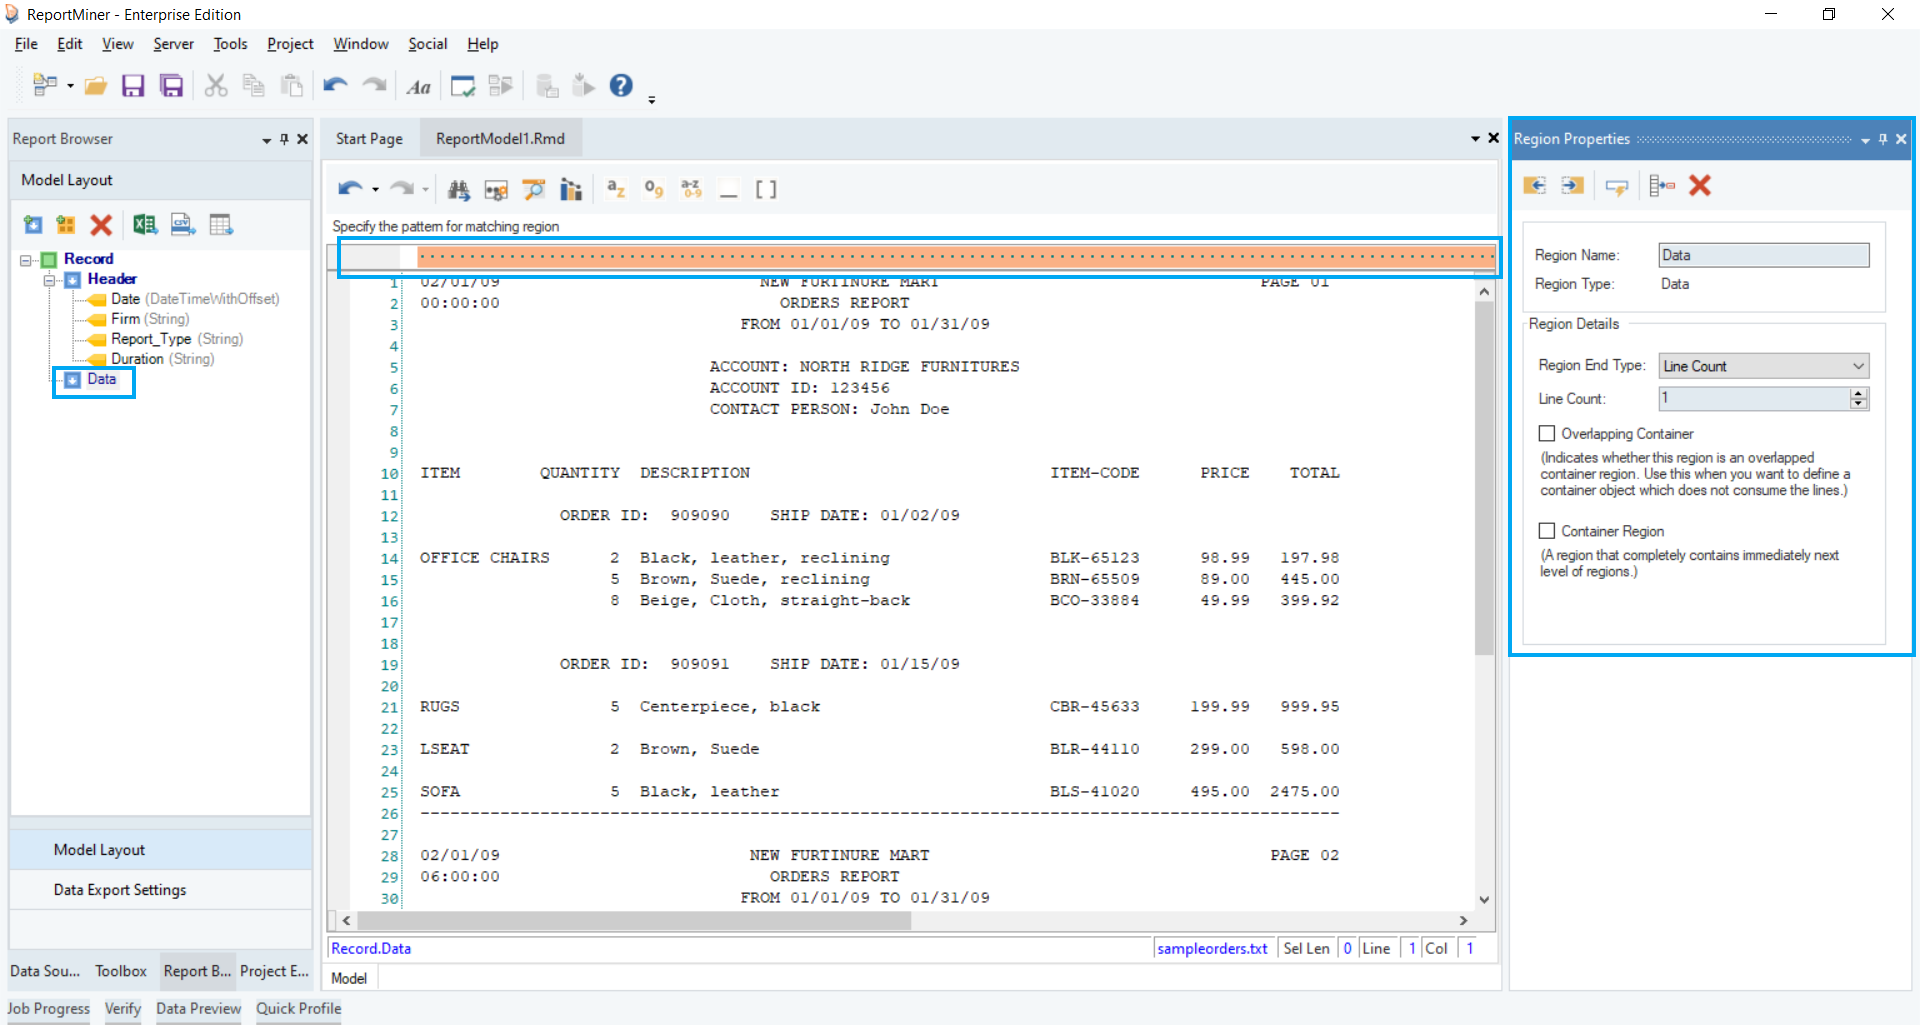
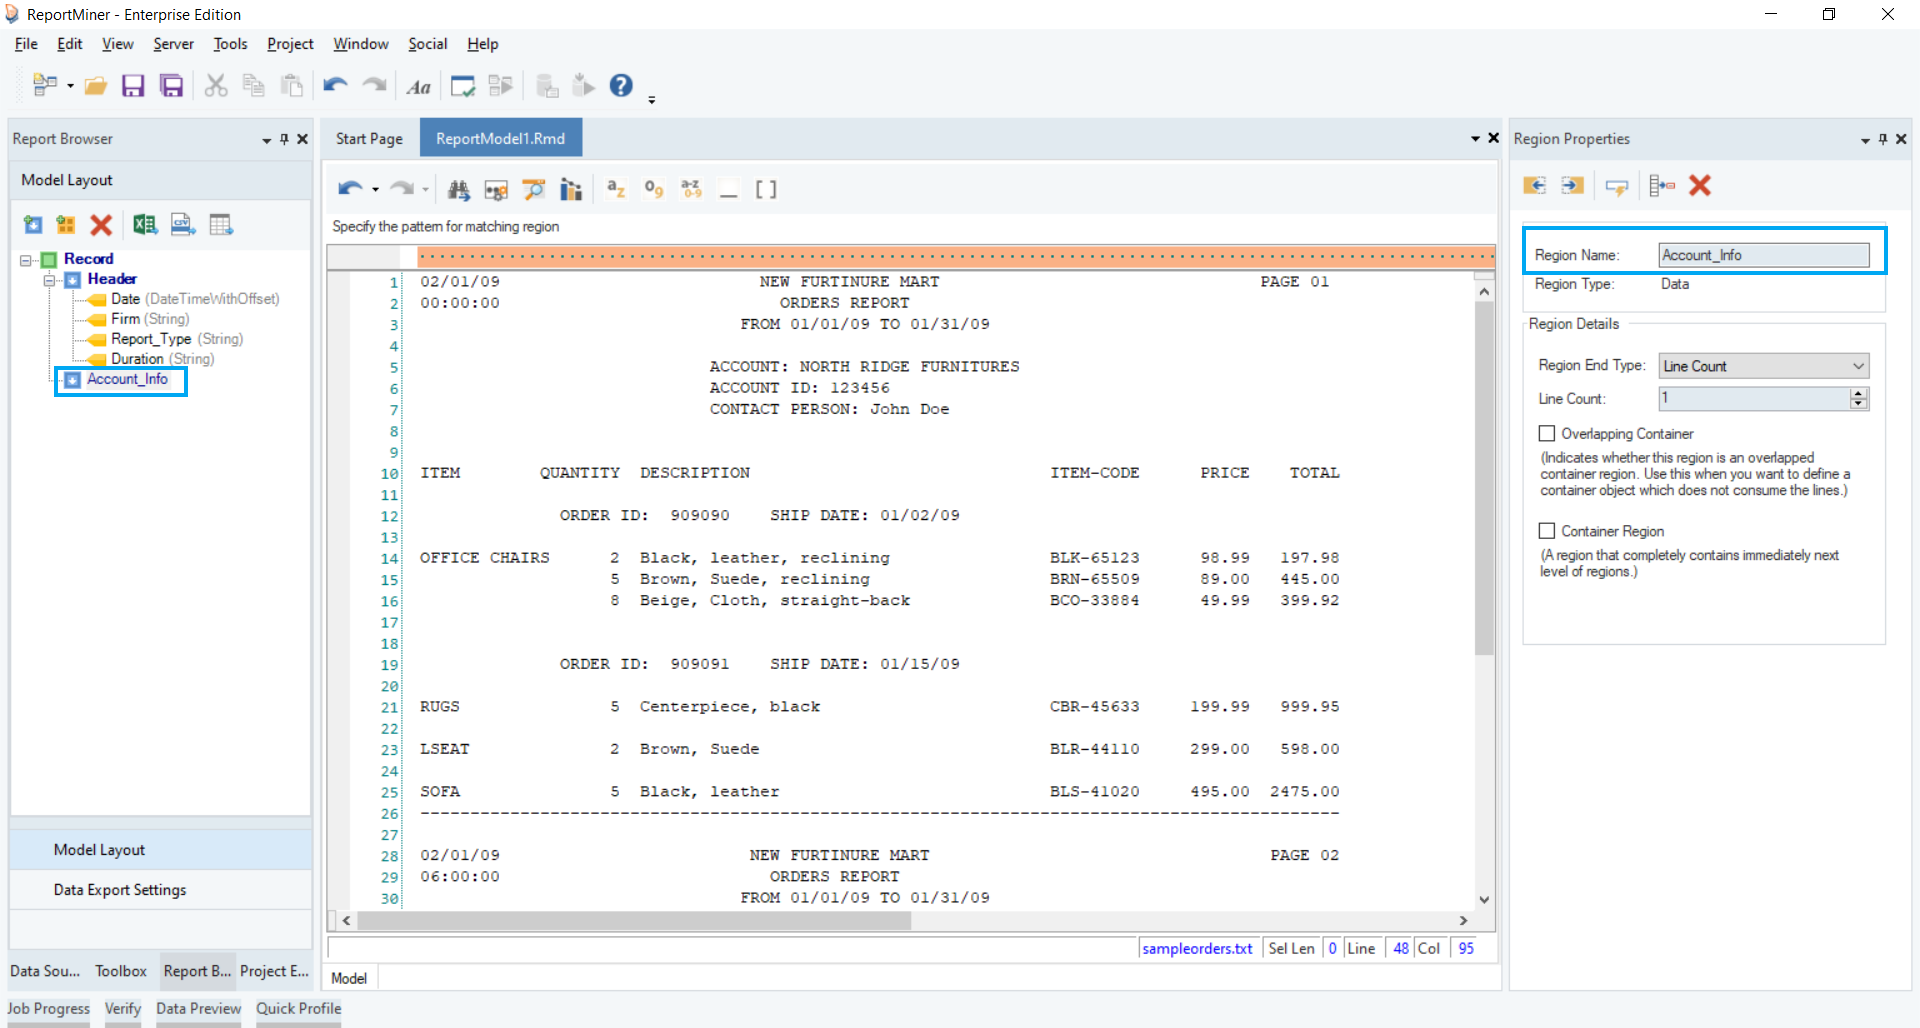
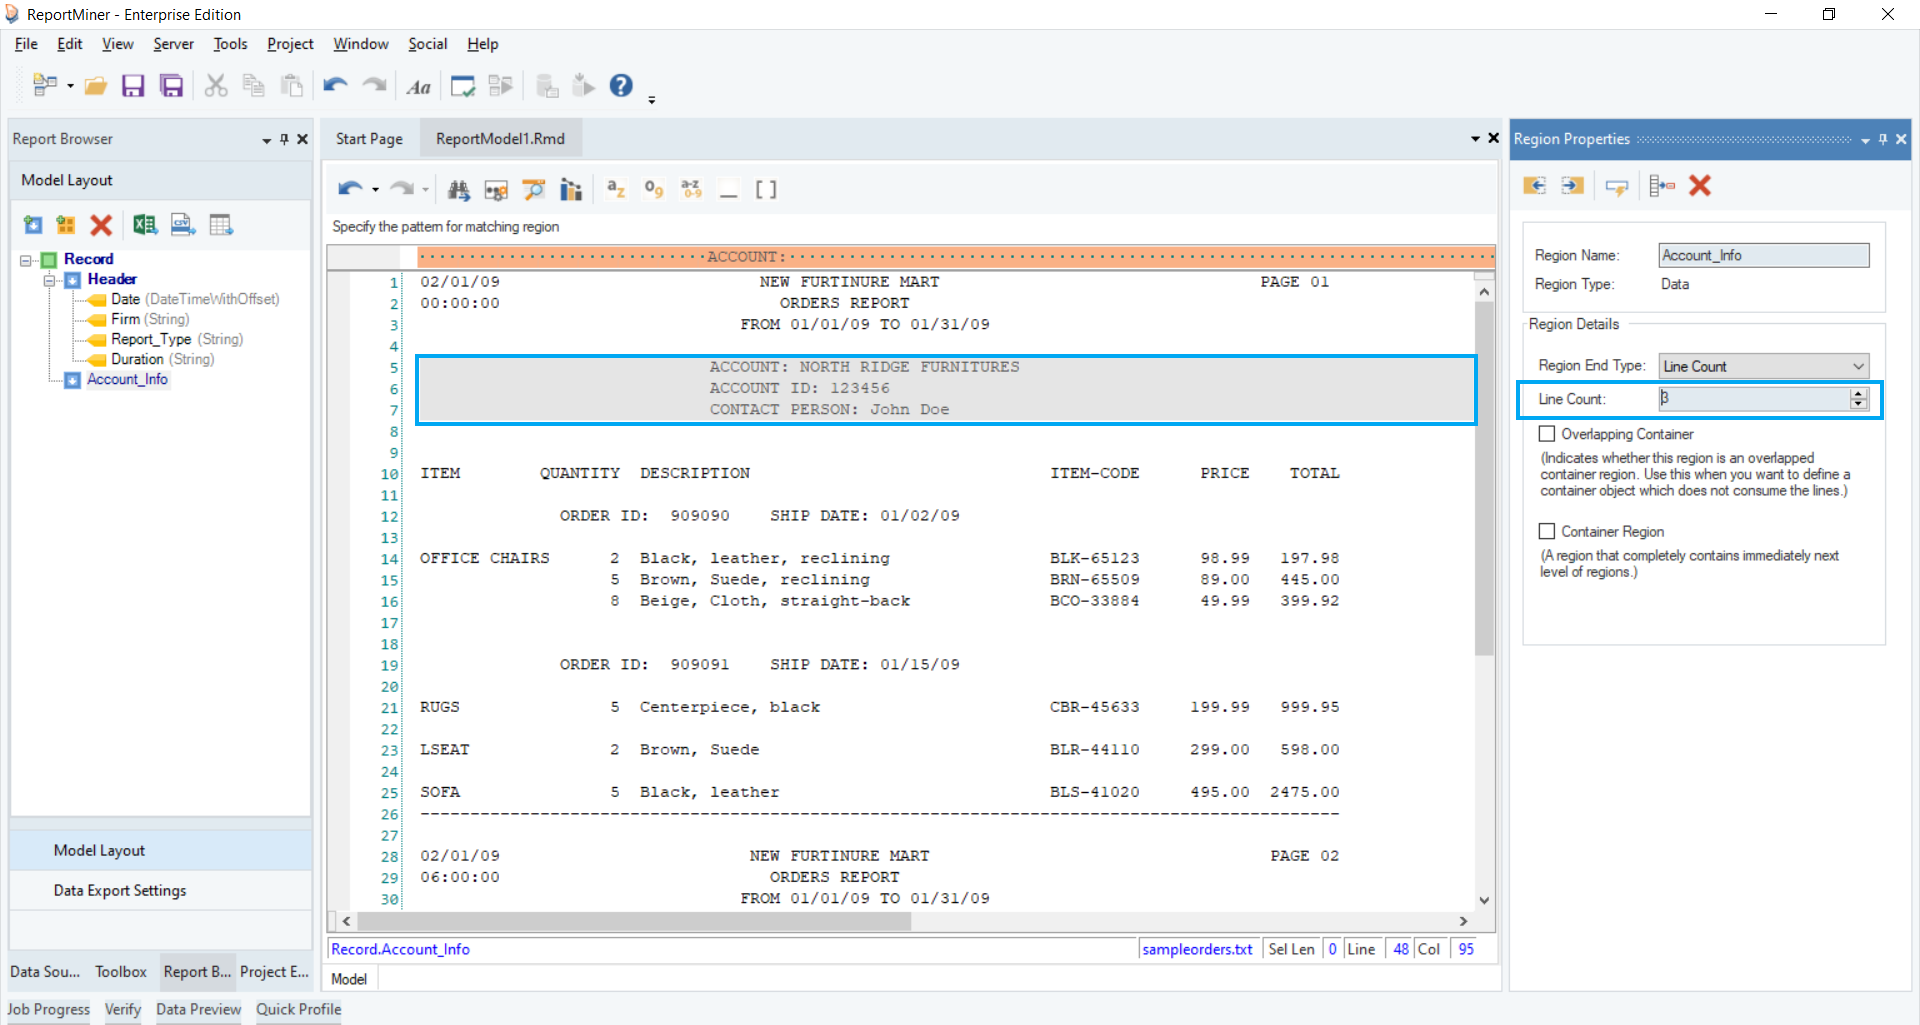
Rename the data region to Account_Info from Region Properties panel.
Specify a pattern that ReportMiner can match on your file to capture data. You can use an alphabet, a character, number, word or a wild card or a combination of these to define your pattern.
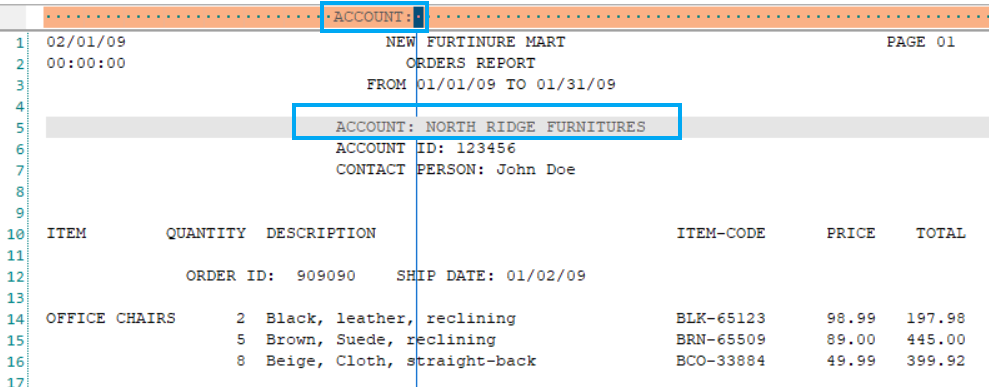
In this case, it’s easy to separate the account information from the surrounding data as they always start with ‘ACCOUNT:’ at the same character position.
On the pattern-matching box, right above account information, type ACCOUNT:
The report model editor now highlights all occurrences of the account region in the report.
Increase the Line Count to 3 to capture all three lines containing account information.
Highlight the field area, right-click and select Add Data Field… from the context menu.
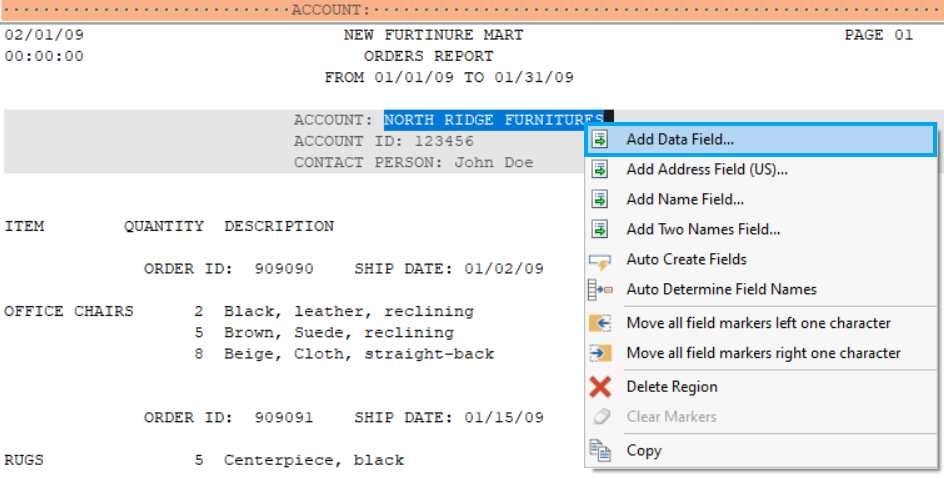
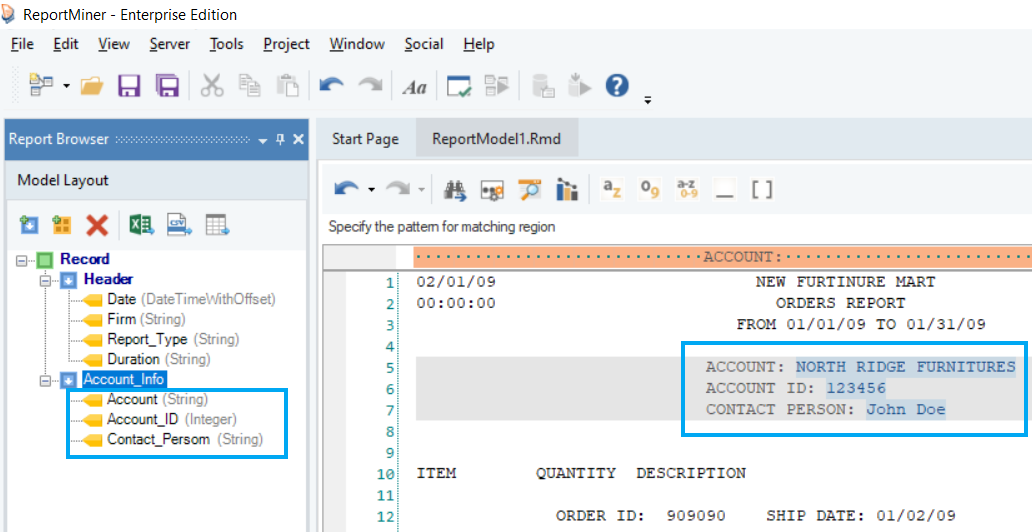
Repeat the process to create more data fields for the Account_Info region and name them, as shown below. You can see the layout of the report model in the Model Layout tab.
The data region has been created for this report, so let’s move on to creating a collection data region.
3. Collection Region
Our sample document has a hierarchical layout. As in, there may be multiple order records for each customer, and each order may have a number of order items in it. To represent this relationship in a report model, we can assign a region as a collection region. This section will demonstrate how to create a Collection region in a report model.
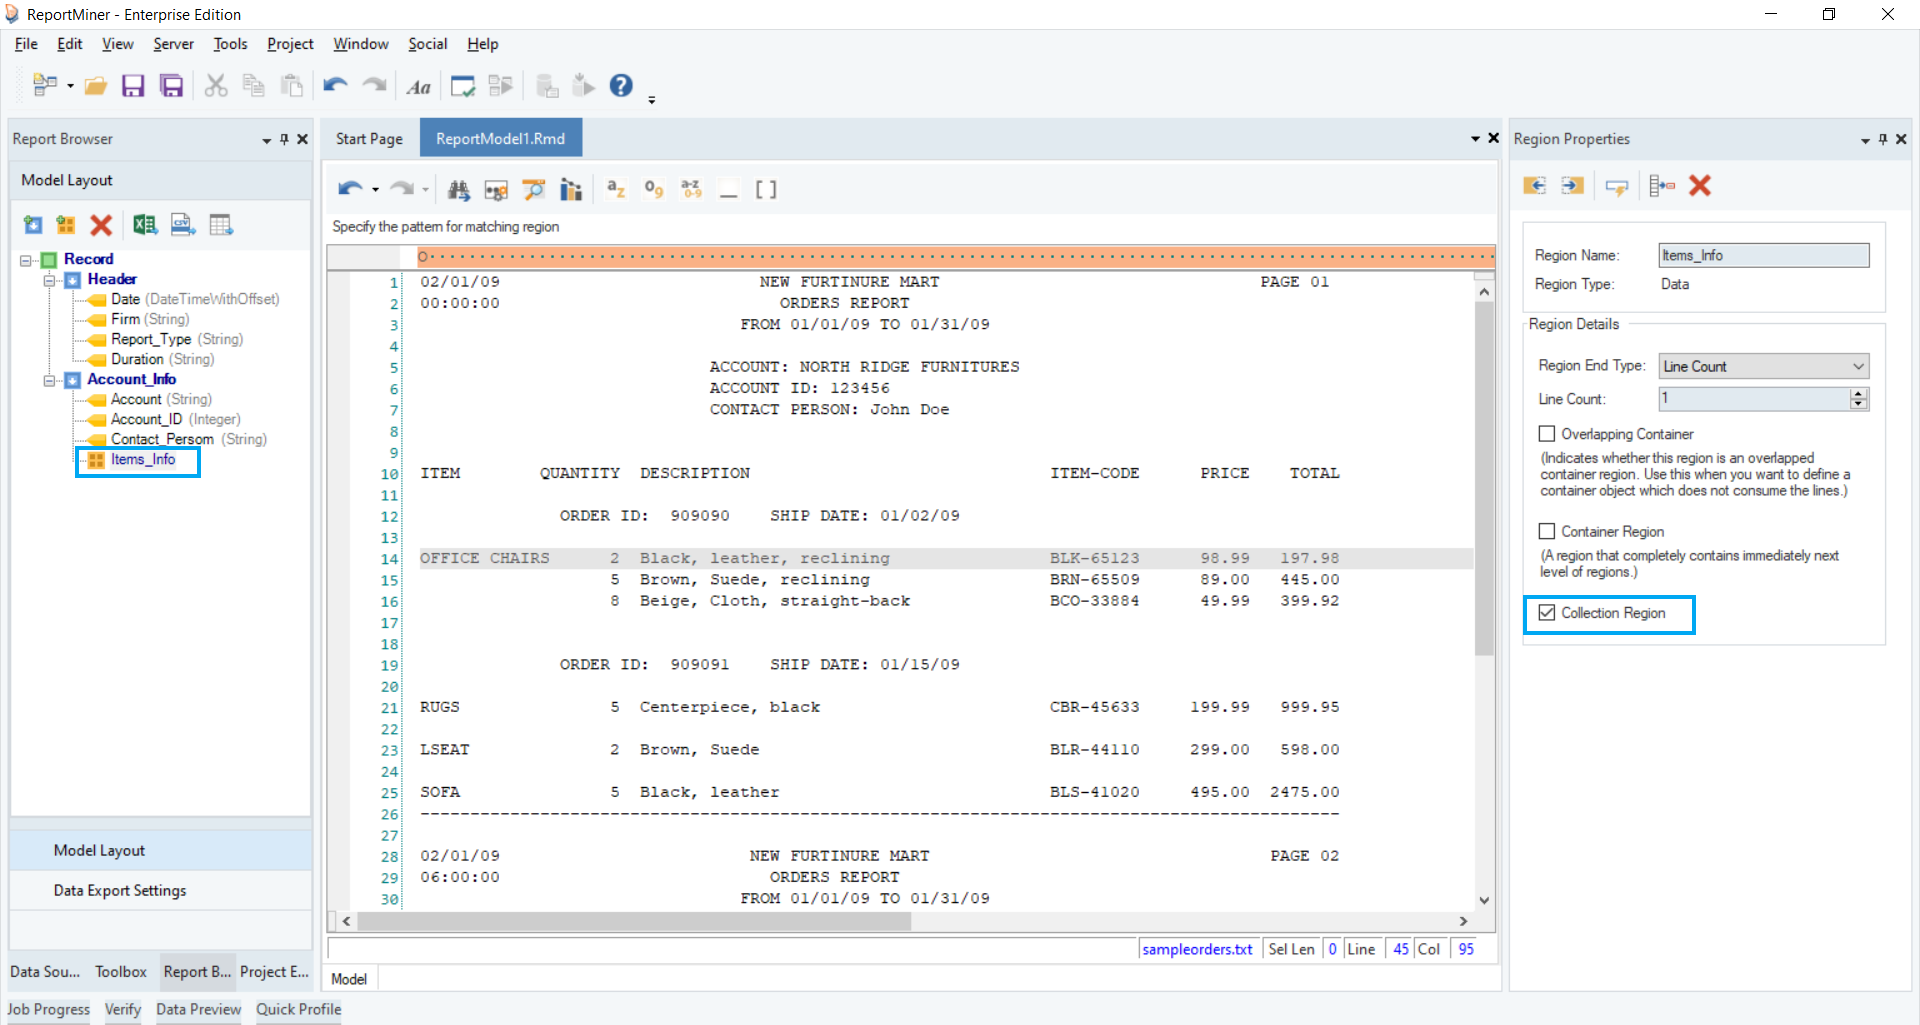
Right-click on the Account_Info node inside the Model Layout tab and select Add Collection Data Region from the context menu.
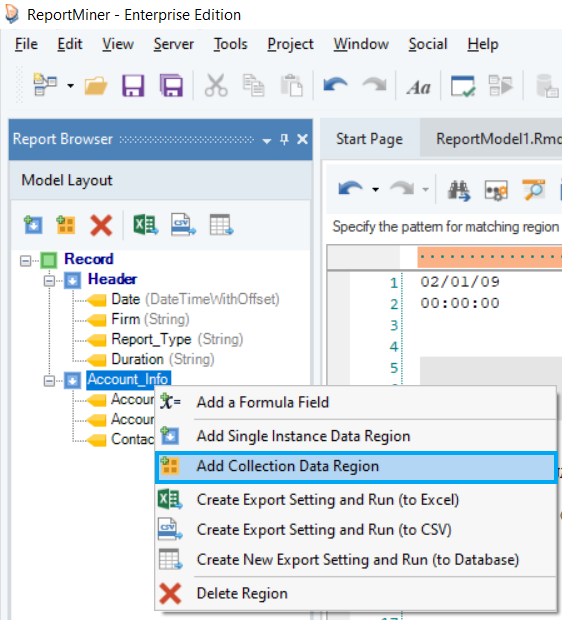
A Data node is added to the report model under Account_Info node, appearing in the Model Layout tab in a hierarchical structure. Rename this node to Items_Info.
Note: When a region has a collection of items in it, we need to enable its Collection Region property from the Region Properties panel. Notice that the icon for the Items_Info is different, to help identify this node as a ‘collection’. When we add a collection data region via the context menu, the Collection Region property is set automatically.
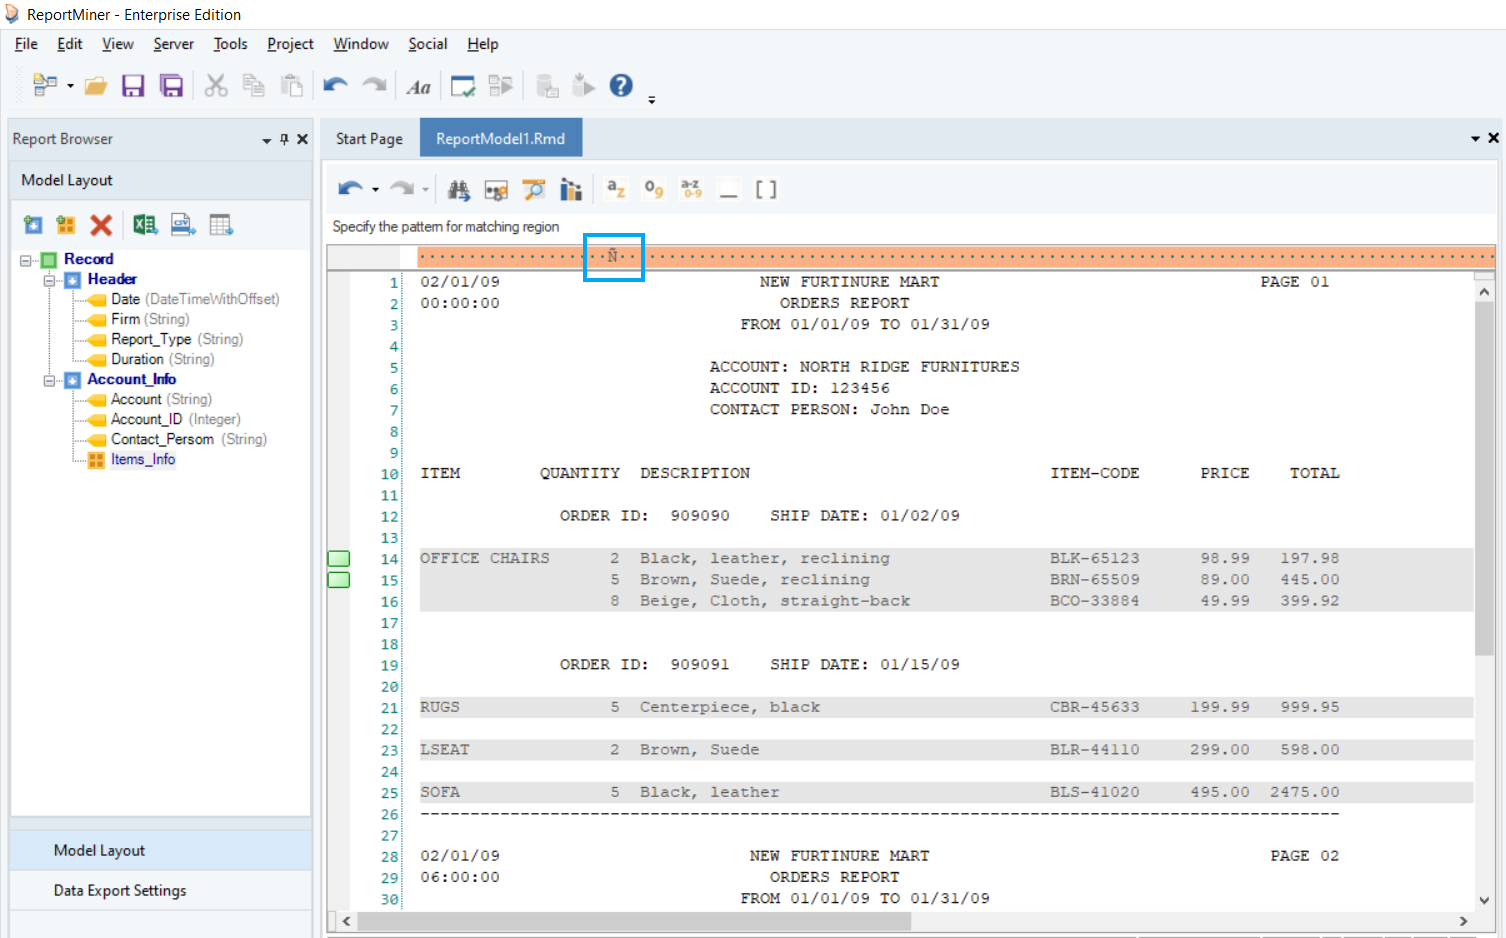
We want to capture the items information from this file. Astera ReportMiner provides the option to select a data region by placing markers next to the line number.
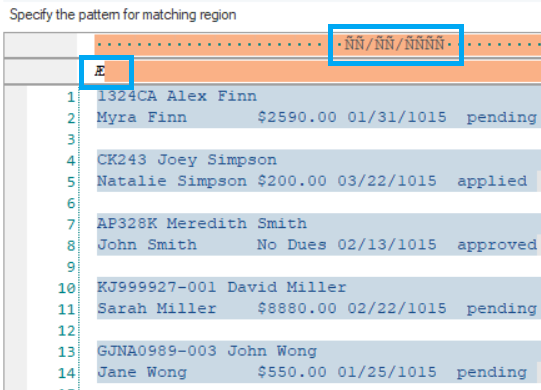
Move your cursor to the gray line on the left. Put up green markers by clicking on this gray line, left to sample lines 14 and 15. Observe that a pattern has automatically been identified in the pattern-matching bar. It is using a wildcard ‘Ñ’ as the matching pattern and has automatically created a data region.
Click on the Auto Create Fields icon placed in the Region Properties panel toolbar.
This will automatically create 6 fields in the Model Layout tab.

Rename each field manually or select Auto Determine Field Names option from the Field Properties panel.
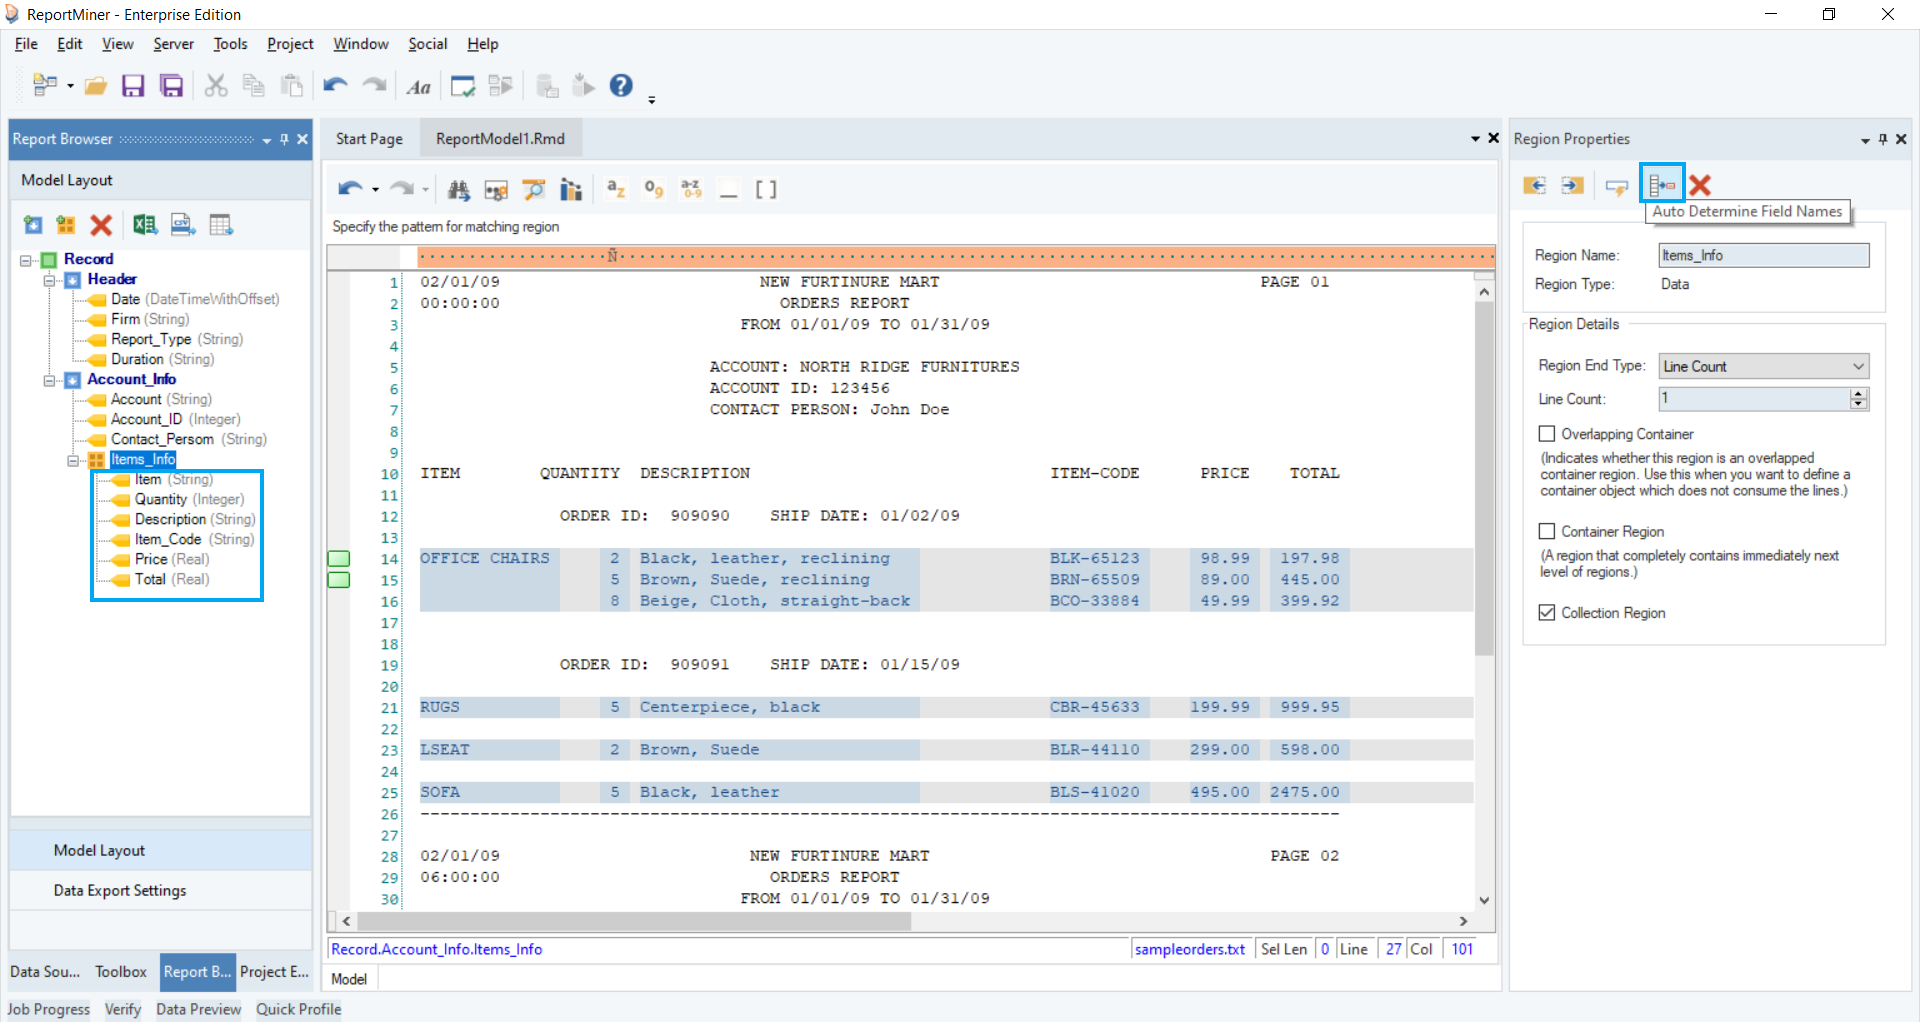
Now, the collection data region has been created for this report.
You can create the Single Instance Data Region, Append Data Region and Footer Region in the same way in a report model.
4. Adding a Formula Field
Astera ReportMiner provides the option to add a formula field in the report model.
- Right-click on the Items_Info node inside the Model Layout panel and select Add a Formula Fields from the context menu.
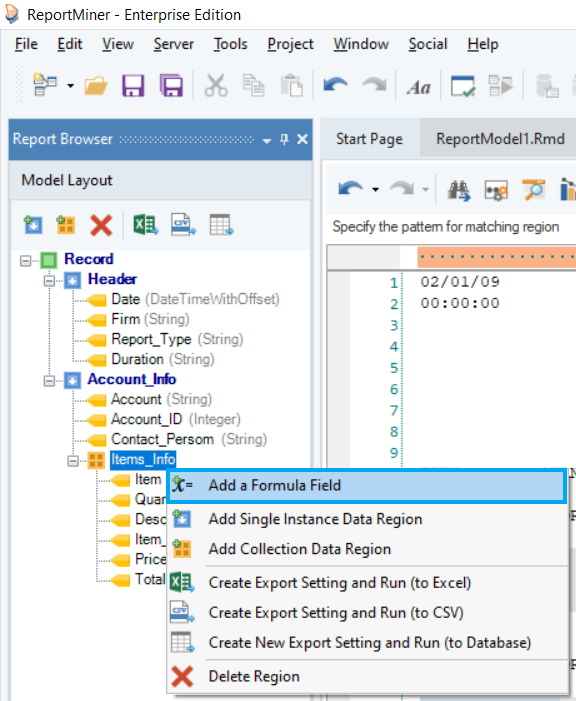
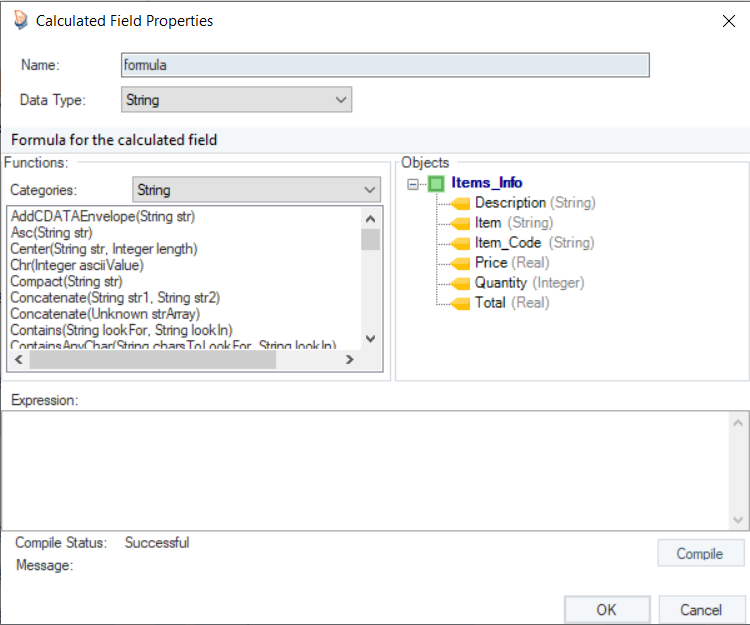
A Calculated Field Properties window will open. This is where you have to specify the formula.
You can see that it contains an expression box with built-in functions. Expand the Items_Info node to access the fields of the extracted data.
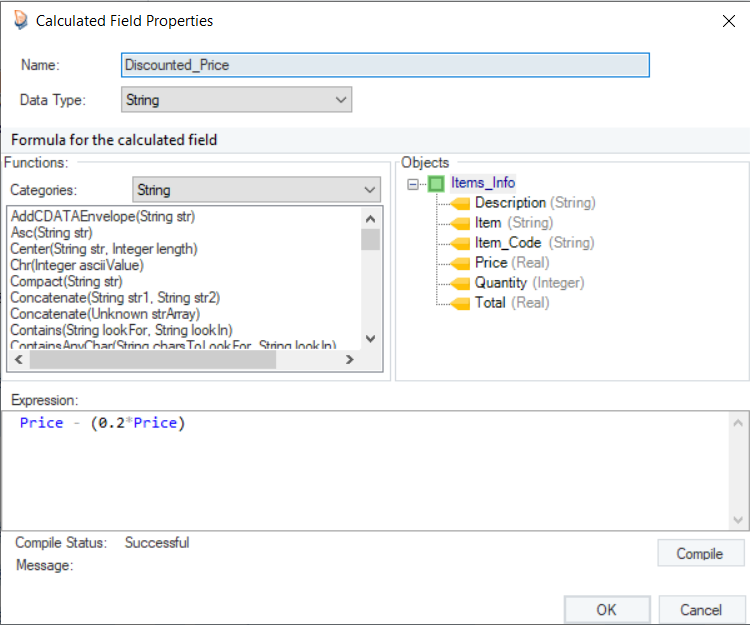
- In the expression builder, type: Price - (0.2Price).
- Rename this formula field as Discounted_Price.
- Click on the Compile button to verify the expression. If it’s successful, then click OK.
You can add multiple formula fields to your report model in the same way.
Step 3: Testing Report Model With Sample Data
Save this report model by clicking on this  icon placed in the menu bar. We can verify the model by previewing the data. This will give an idea on how the report document is processed using the report model we created and how the data has been extracted.
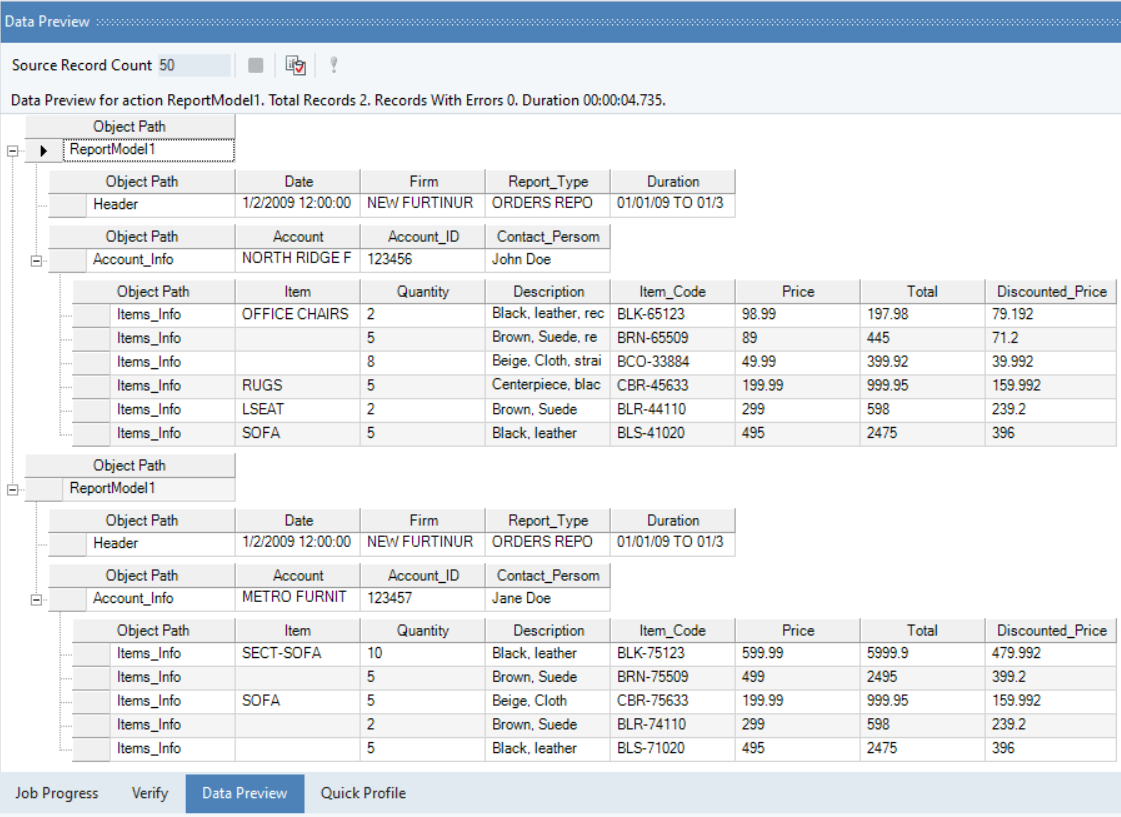
To test the model and preview the extracted data, click on the Preview Data icon  placed in the toolbar. This will open the Data Preview window, showing the entire report structure with the actual values for all the defined fields.
Data Statistics and Summary
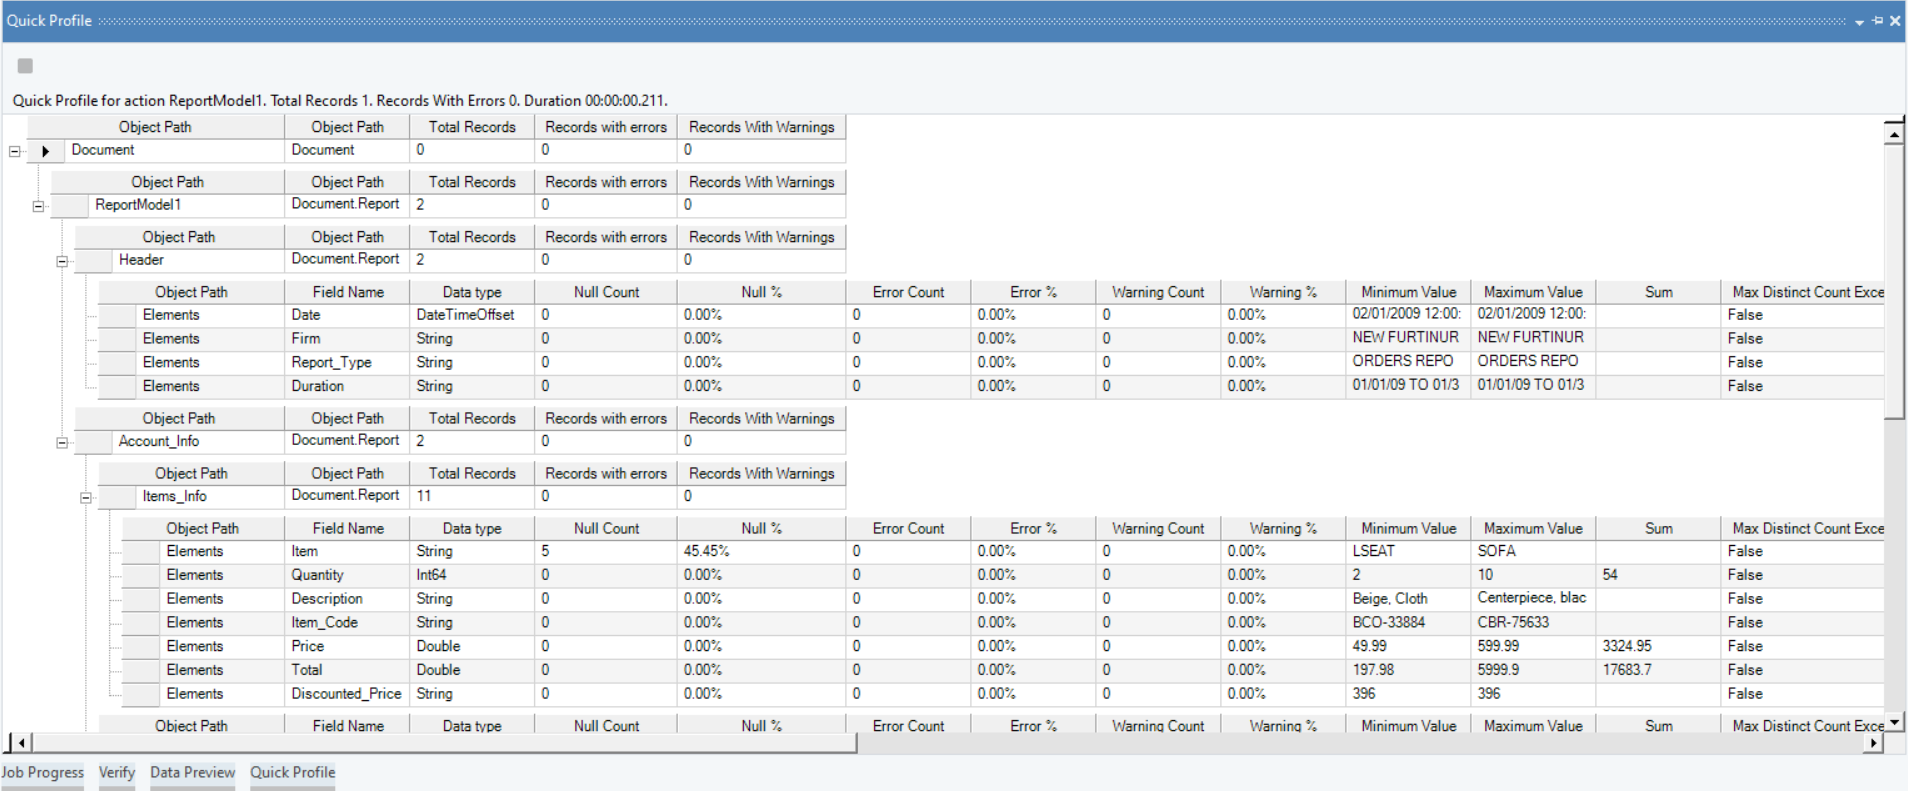
In Astera ReportMiner, you can capture a summary of extracted data fields including aggregated values such as sum, average, count, etc. To view detailed statistics of extracted data, click on this  icon in the toolbar. The Quick Profile window will open displaying detailed statistics of the extracted data as shown in the figure below.
Let’s learn in detail how to export data in ReportMiner to an Excel destination.
Export to an Excel Destination
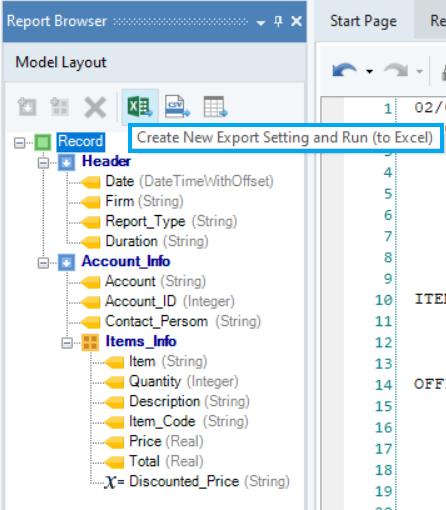
Select the Create New Export Setting and Run (to Excel) option placed on the toolbar at the top in the Model Layout tab.
When exporting data to an Excel file, you can either choose a new destination to save your file to (a folder or directory) or append the data to an existing Excel file.
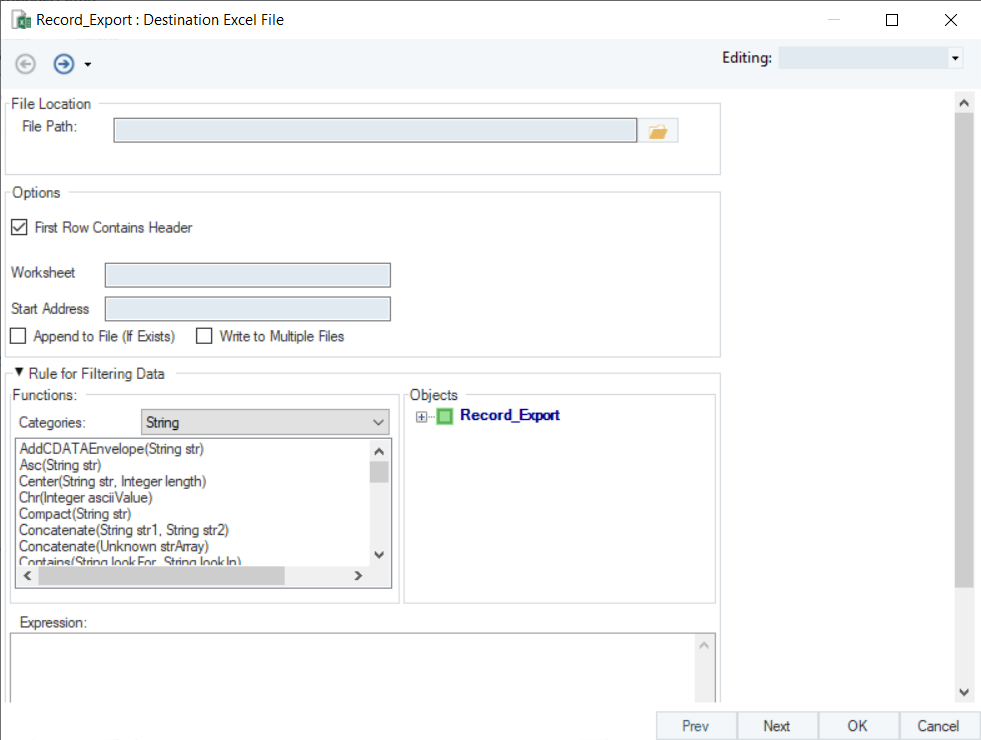
First you need to provide the destination file path, and then you can specify the other options on the export setting window.
- First Row Contains Header – check this option if you want to include the data field names as headers in the output file.
- Worksheet – you can specify the title of the worksheet the data is being exported to within the excel file.
- Append to File (If Exists) – adds the exported data to an existing Excel file without overwriting the data it contains.
- Write to Multiple Files – saves the exported data to multiple Excel files instead of one single file. Specify the same file in multiple Excel destinations and ReportMiner will create a single file with multiple worksheets and write all data to that file.
- Rules for Filtering – specifies a criterion to export only filtered records. On expanding, users can see an expression box with built-in functions to facilitate rule-based filtering. This feature is explained in detail in the next section.
After configuring the export settings, click Next. This takes us to the Layout Builder screen where you can customize data fields in the layout.
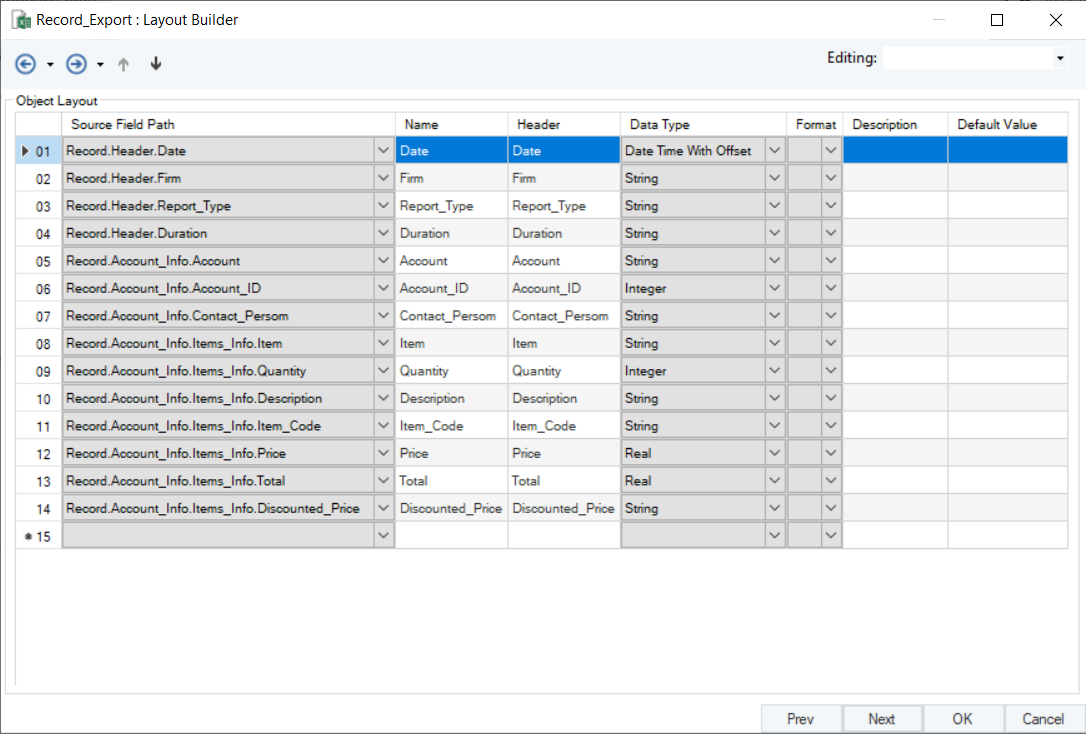
- Source Field Path – shows the name of the fields that are being exported.
- Name – is the name of the field within the program, whereas Header is the text that will be exported as a header in the destination.
- Data Type – specifies the type of data being exported e.g. integer, real, Boolean etc.
Click Next. This will take you to the General Options window where you can select different options as per your requirements.
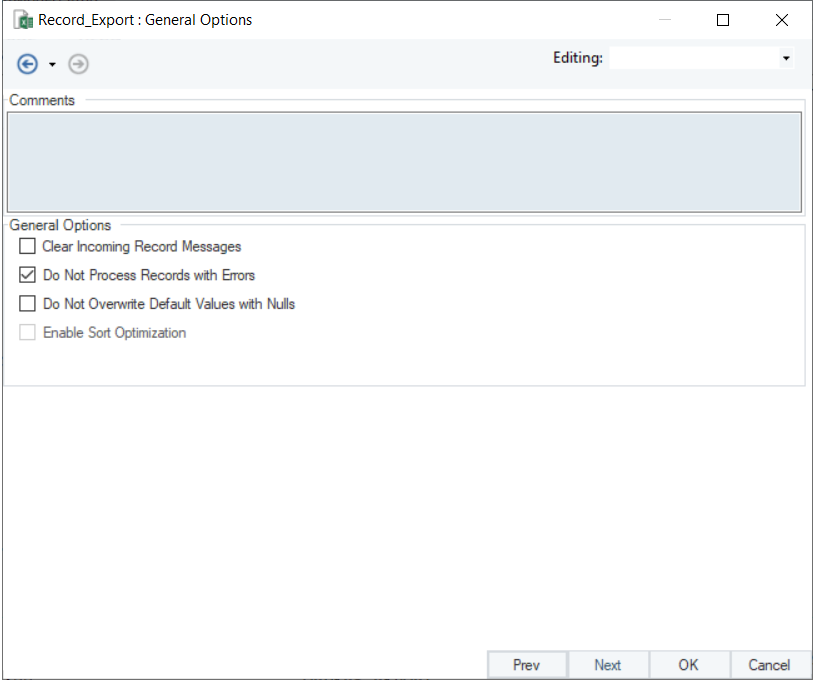
Click OK and your file is ready to be exported.
You can find more information on other data exporting options in ReportMiner such as to a CSV file and a Database Table destination in this article – Exporting a Report Model.
Rule-Based Filtered Export
While exporting data from ReportMiner, you have the option to send only filtered data to your export destination.
Select the export destination of your choice. A Configuration window will open where you need to provide the destination file path. On the same window, you will see the option to specify Rule for Filtering Data (in blue). Click on  to expand it.
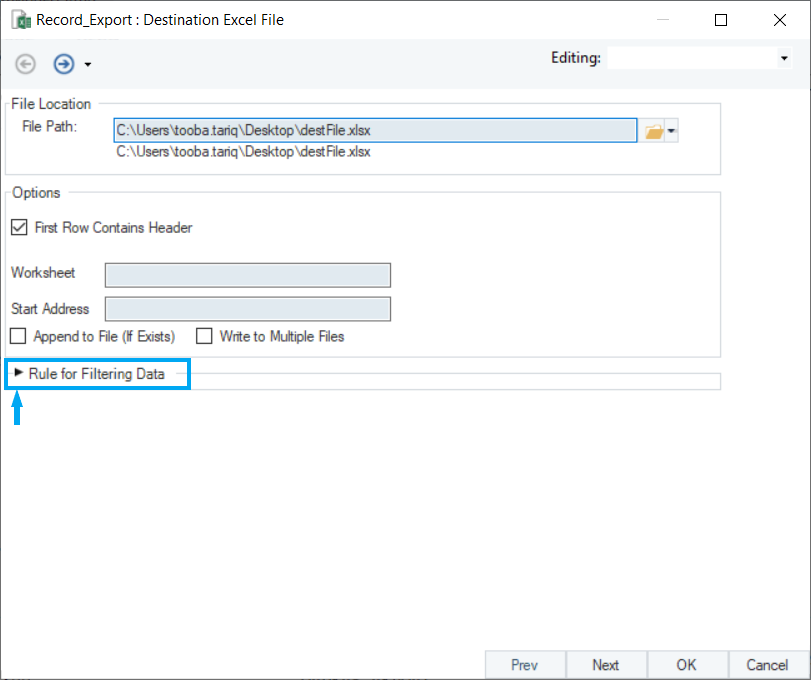
An expression box with built-in functions will open. Expand the Record_Export node to access the fields of the extracted data.
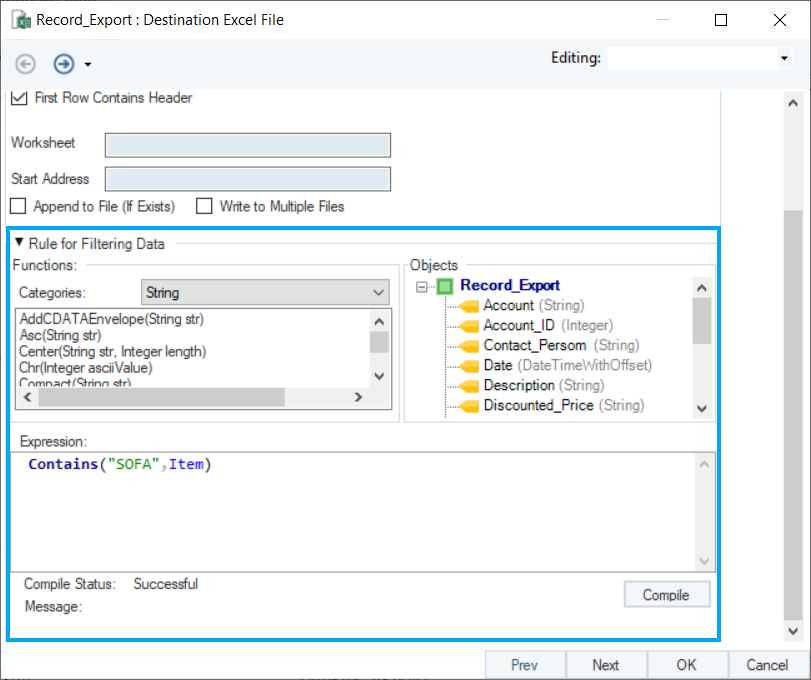
In this example, we only want to export the data that contains SOFA in the Items field.
For that, we’ll write Contains(”SOFA”,Item) in the Expression builder. Click on the Compile button to verify your expression.
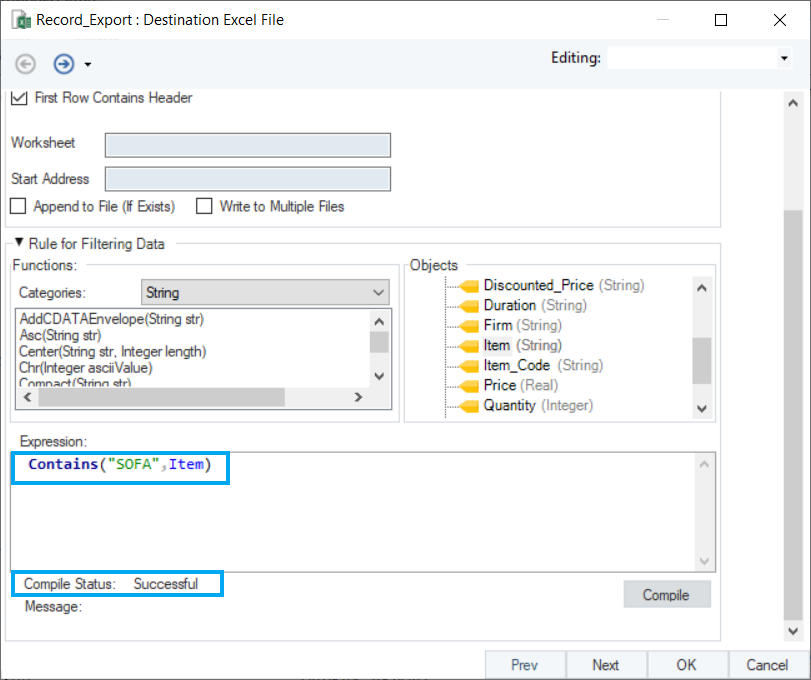
When the Compile Status is ‘Successful,’ click OK to close the export settings window. Your export will now begin. You can observe the progress through job trace in the Job Progress window.
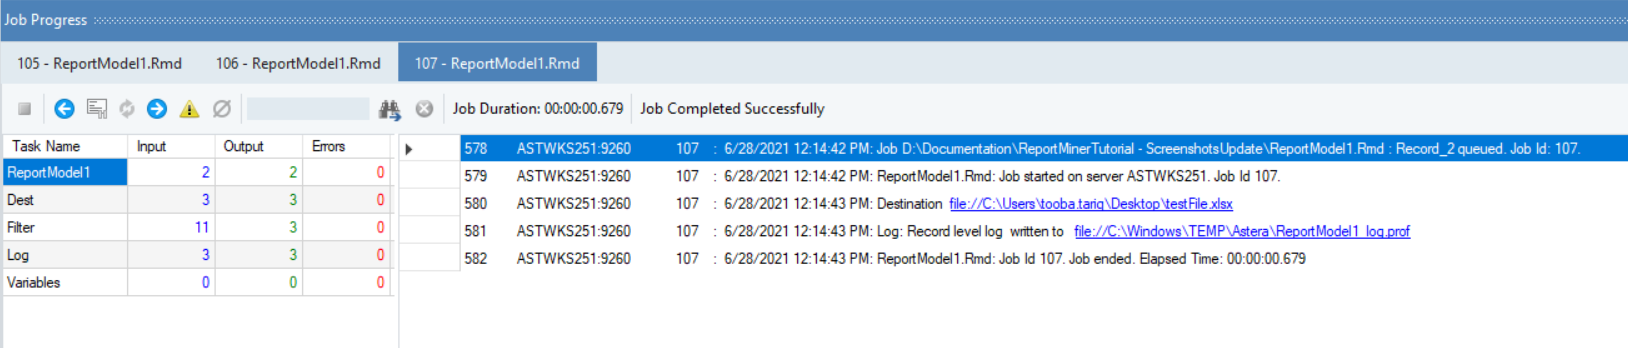
At the end of a successful run, a clickable link for the exported data file will be generated in the job trace. Click on this link and your exported data will open in Excel file.
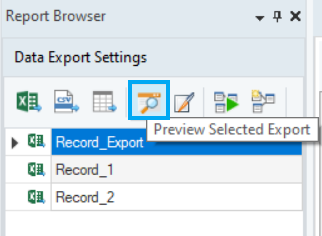
There is also an option to preview your export setting to see what the data will look like in the output file before running the export.
You can do this by going to Data Export Settings tab and clicking the Preview Selected Export icon ![]() .
.
Using Dataflows in ReportMiner
ReportMiner enables users to create and run dataflows for the extracted data. A dataflow is a graphical representation of the journey of data and includes sources, destinations, transformations, and object maps. It may also include a set of transformations mapped in a user-defined sequence. Generally, the data is retrieved from one or more data sources, is processed through a series of transformations, and then the transformed data is written to one or more destinations.
You can learn more about dataflows and its tools from here.
A report model can be used as a source in dataflows to leverage the advanced transformation and integration features in ReportMiner.
There are two ways to create and use dataflows in ReportMiner.
Creating Dataflows From Data Export Settings
ReportMiner enables users to create a dataflow directly from the Data Export Settings panel.
Once you have exported the extracted data to an Excel sheet, a delimited file or a database table, go to Data Export Settings panel and click on Create Dataflow and Open icon  .
.
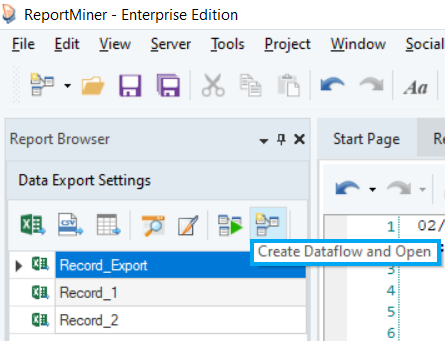
A new dataflow, typically containing a Report Source object, a destination object and a Record Level Log object will open in ReportMiner.
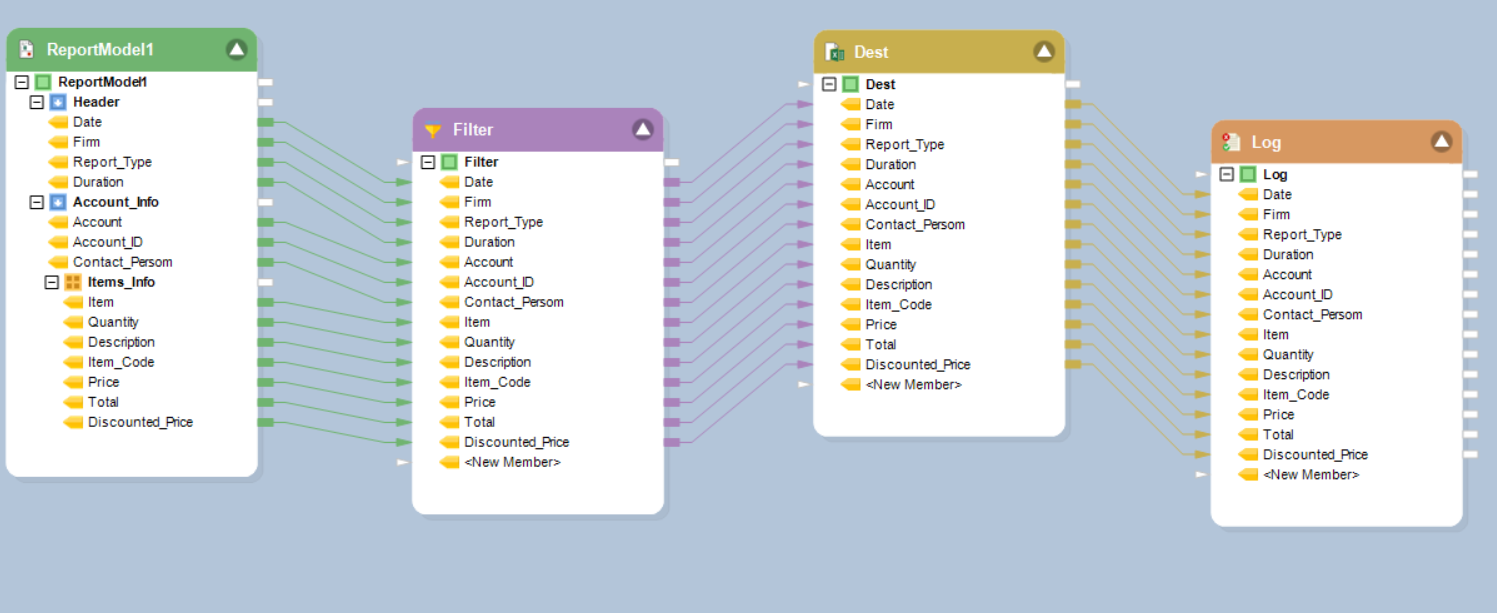
In this example, the dataflow that has been created contains a Report Source object, a Filter Transformation object (since we filtered out the exported data on the basis of Items), an Excel Workbook Destination object (for the Excel file we exported the data to), and a Record Level Log object.
To learn more about how this option works in Astera ReportMiner, refer to the article – Exporting a Report Model to a Dataflow.
You can add more transformations to this dataflow, apply Data Quality Rules or write the data to a new destination.
Creating a New Dataflow
To open a new dataflow in ReportMiner, go to File > New > Dataflow.
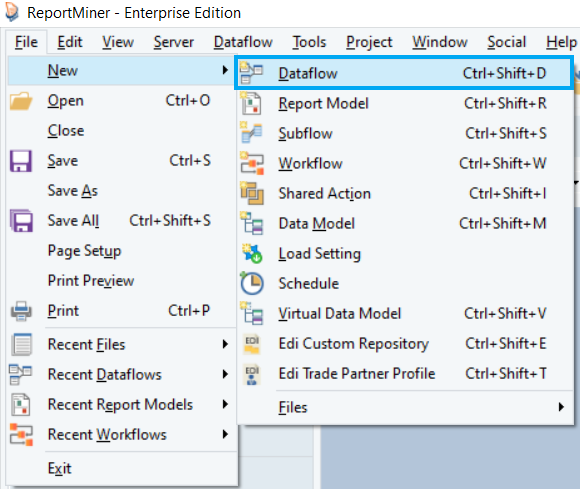
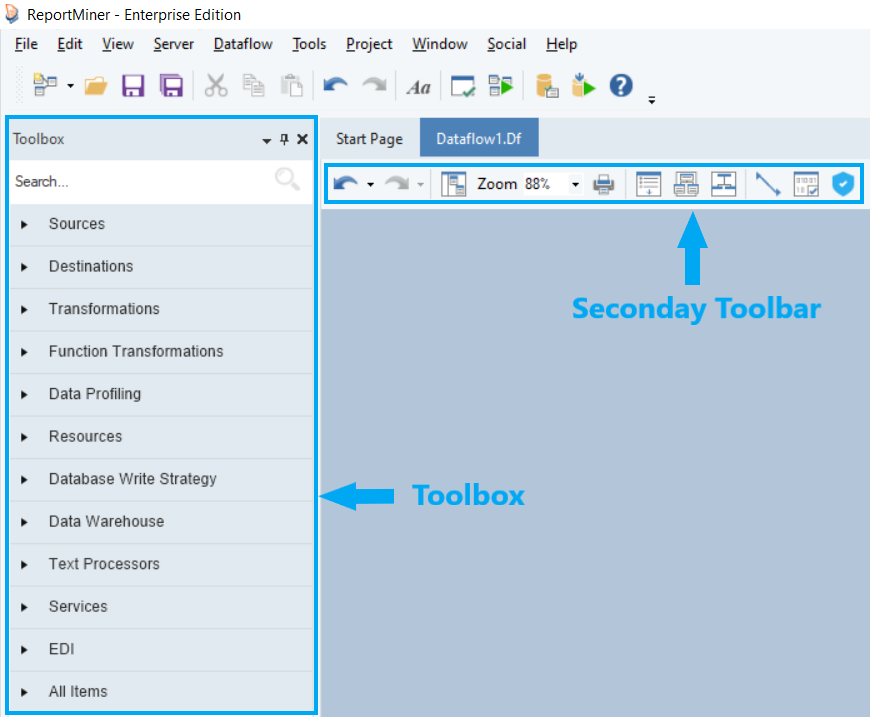
A new dataflow will open in ReportMiner. You can see that a Toolbox and a secondary toolbar has been added to the designer. Click here to learn more about the different functionalities available in a dataflow.
Let’s add this report model to a dataflow by using a Report Source object.
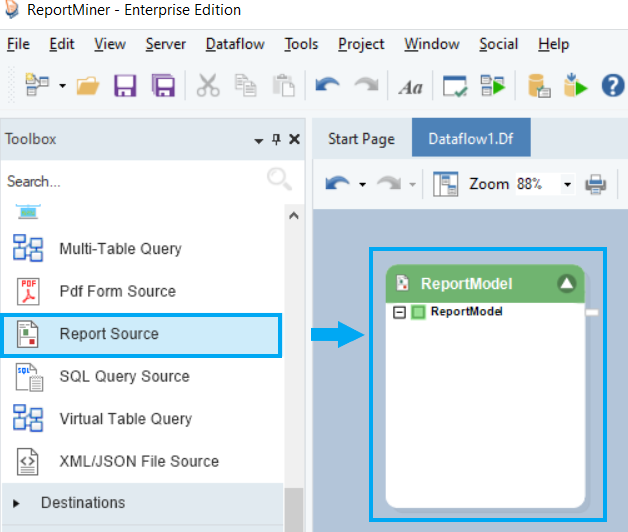
Expand the Sources section in the Toolbox, here you will find the Report Source object. Drag and drop the Report Source object onto the dataflow designer.
The Report Source object is currently empty and needs to be configured.
Right-click on the header of the Report Source object and configure the properties to retrieve report model data into the dataflow. Click here to learn more about configuring the properties of Report Source object.
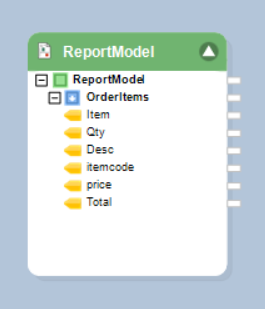
Once the source object has been configured, the Report Source object on the dataflow designer will show the fields with layout according to the report model you have created.
The data is now ready to be transformed. Astera ReportMiner offers 26 built-in transformations to facilitate any kind of data transformation – from basics such as Aggregate, Sort and Filter to advanced transformations such as Tree Join, Switch and Normalize.
Click here to learn more about the purpose and functionality of the different transformations you can use in a dataflow.
After transformation, this data can be loaded to 5 different destinations*:* Database Table Destination, Excel Workbook Destination, Delimited File Destination, Fixed Length File Destination and [XML/JSON File Destination](XML/JSON File Destination).
Using PDF Form Source
The PDF form source in Astera ReportMiner enables users to extract data from a PDF file directly without creating an extraction template. This saves the need to create a report model since ReportMiner reads the layout of the PDF form automatically including check-boxes and radio buttons.
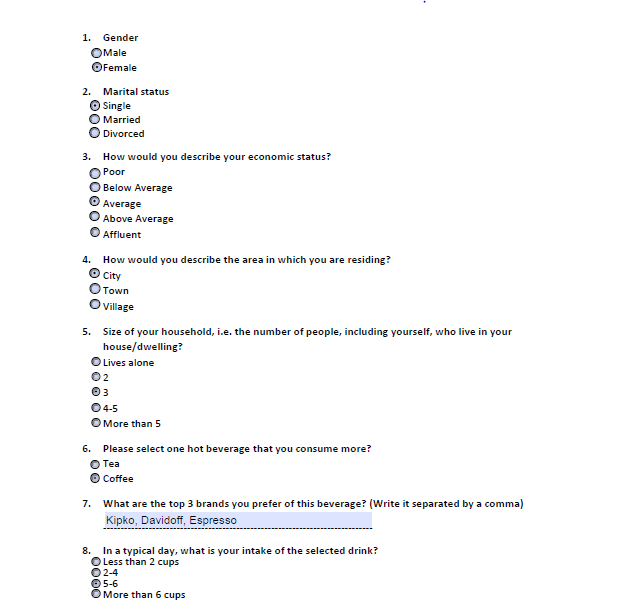
In this example, the data that we want ReportMiner to read is contained within a PDF form as shown below. This form has radio buttons as well as text boxes.
It is not feasible to create a report model to extract this data because:
1. ReportMiner’s designer does not pick up radio buttons and check boxes; and
2. If you want ReportMiner to read a bulk of similar forms, a single model can’t possibly be applied to all the forms since each form will contain different answers.
To cater to these issues, we will use a PDF Form Source object in a dataflow.
Under the Sources section in the Toolbox, you will find the PDF Form Source object.
Drag and drop the PDF Form Source object onto the dataflow designer.
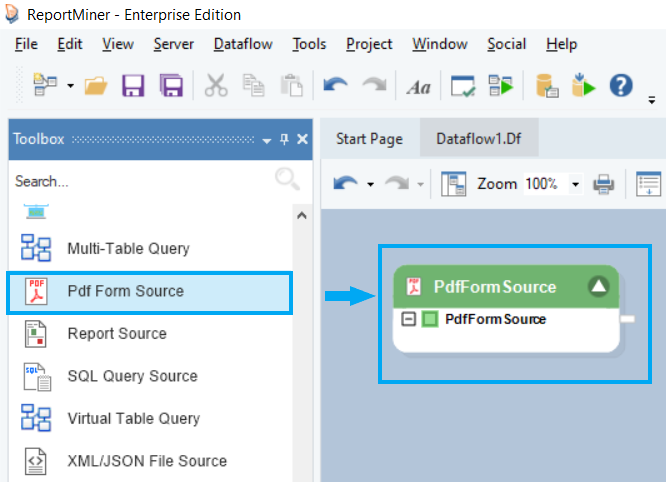
You can see that the object is currently empty and needs to be configured.
Right-click on the header of the PDF Form Source object to configure its properties and retrieve data into the dataflow.
Click here to learn more about configuring the properties of PDF Form Source object in a dataflow.
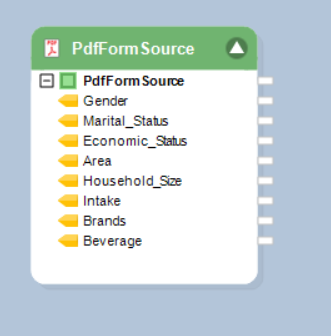
Once the source object has been configured, the PDF Form Source object on the dataflow designer will show the fields with layout defined in the PDF Form.
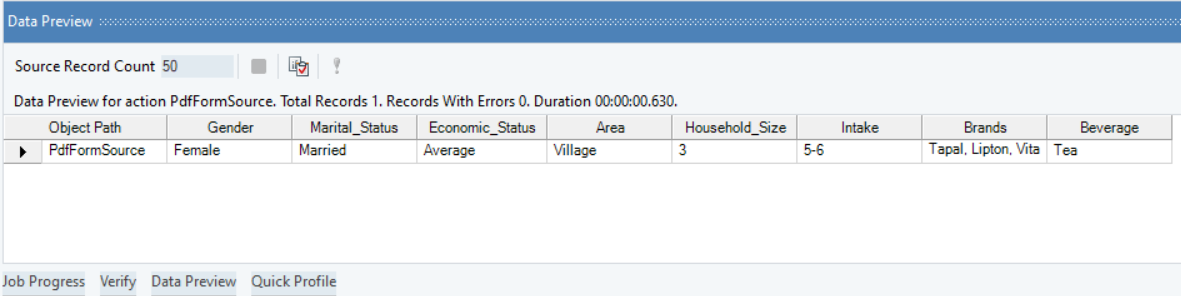
You can preview the extracted data by right-clicking on the source object and going to Preview Output.
A Data Preview window will open and show you the extracted data.
Using Email Source
Email Source in Astera Centerprise enables users to retrieve data from emails and process the incoming email attachments.
It enables users to watch any email folder for incoming emails, and then process the incoming email attachments through a report model.
Under the Sources section in the Toolbox, you will find the Email Source object.
Drag and drop the Email Source object onto the dataflow designer.
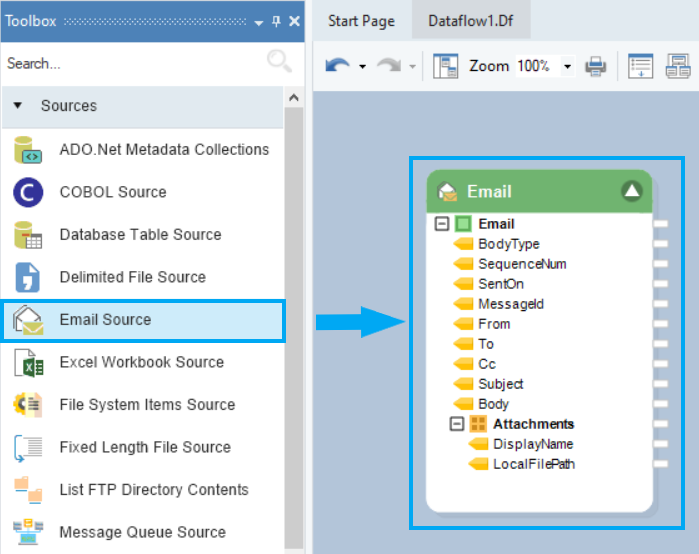
You can see some built-in fields and an Attachments node in the object layout.
Right-click on the Email Source object to configure its properties and retrieve data into the dataflow.
Click here to learn more about using the Email Source object in a dataflow.
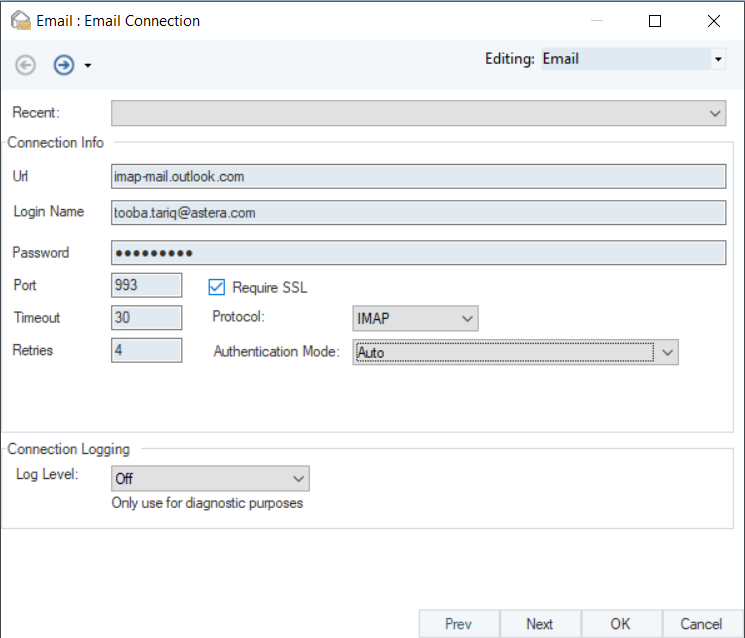
On the next screen, enable the Download Attachments option, specify the email folder for Report Miner to watch for incoming emails. You can also apply various filters to process only specific emails in the folder.
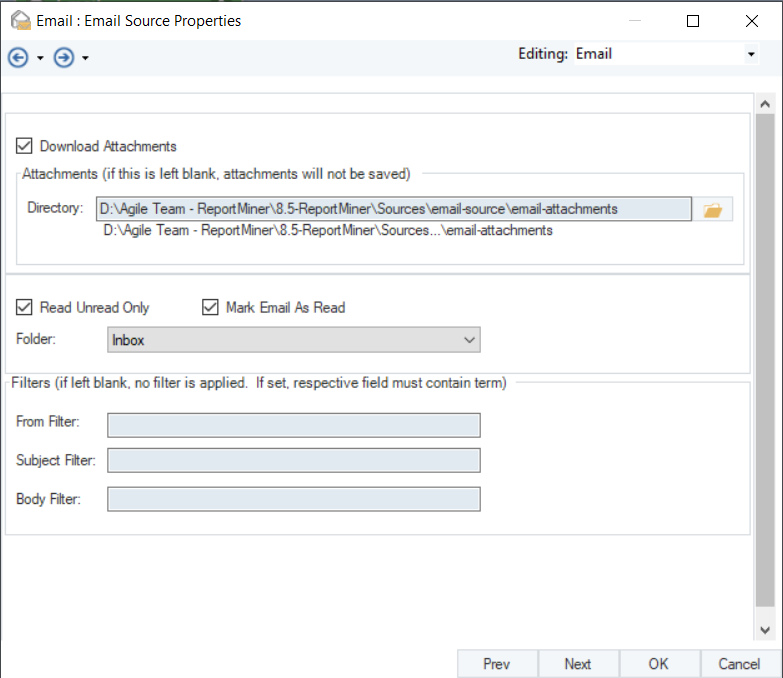
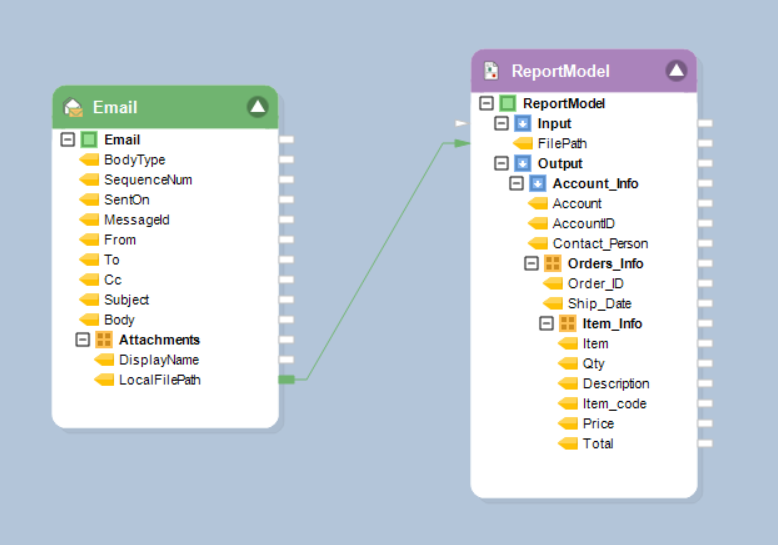
To apply a report model on the attached unstructured files, use Report Source as a Transformation as shown below.
Applying Data Quality Rules
Astera ReportMiner can perform validation checks on the incoming records by applying custom business rules, anywhere in the data integration process. Records that fail to match the specified rules are returned as errors. These validation checks are carried out by Data Quality Rules object found under the Data Profiling section in the toolbox.
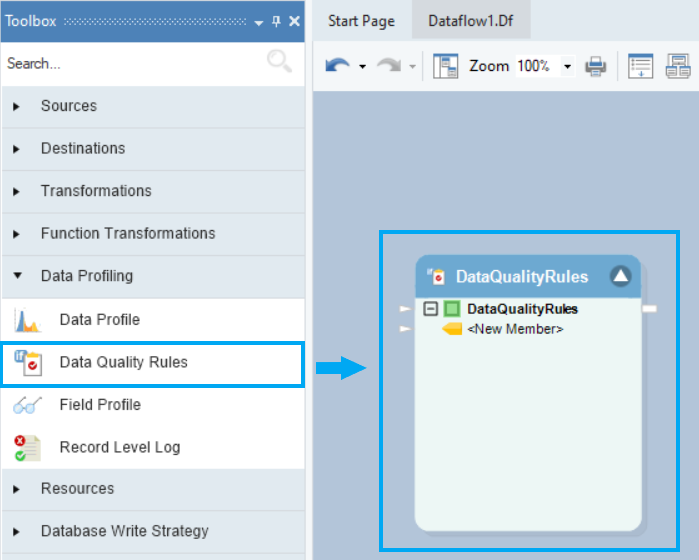
To apply data quality rules, go to the data profiling section and drag and drop the Data Quality Rules object onto the dataflow designer.
Map the dataset using Report Source object to the Data Quality Rules object.
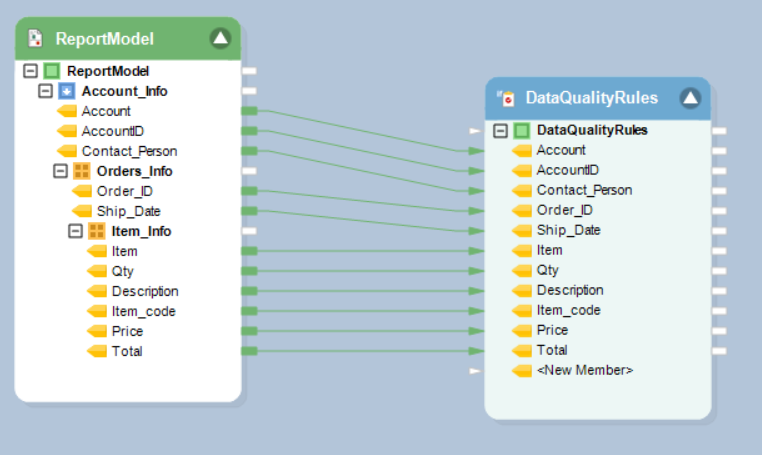
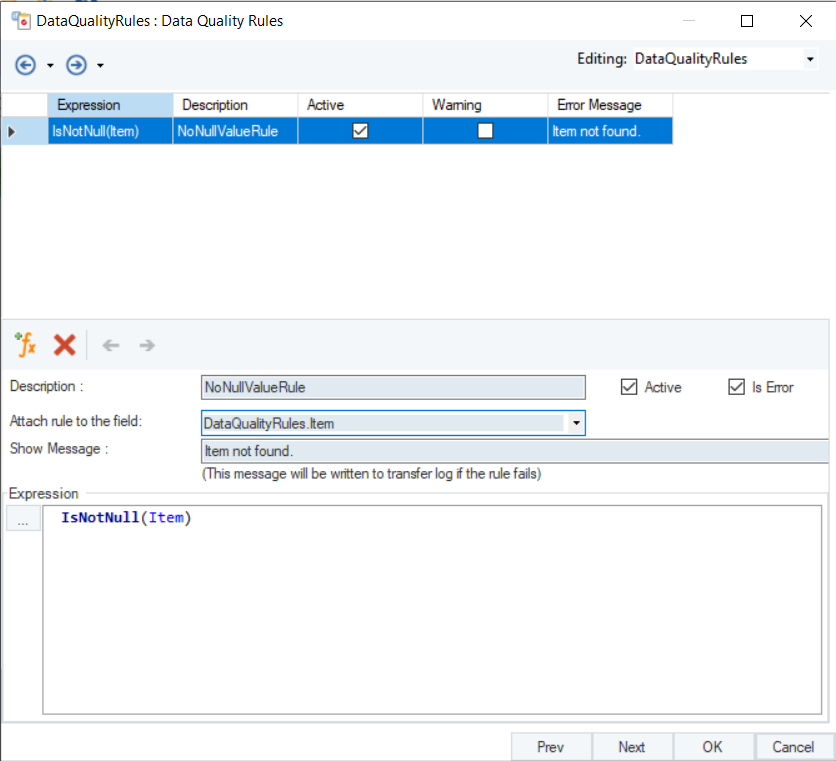
On the Properties window of Data Quality Rules object, define a rule against which your data will be validated. You can apply as many rules as you want within a single Data Quality Rules object.
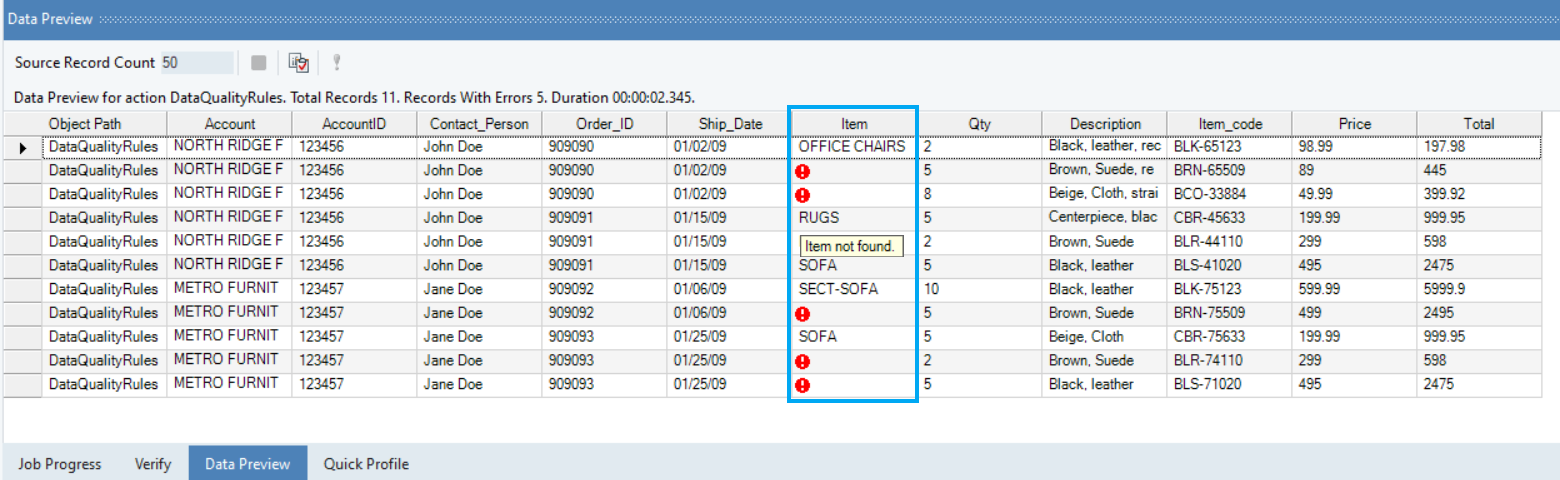
In this example, a Data Quality Rule is applied to identify null records in the Items field as errors with an error message: “Item not found”.
Preview the data to check how the erroneous records are displayed. If you move the cursor over the red warning sign, it will show the error message in the tooltip.
Workflow Orchestration
A workflow is designed to orchestrate an automated and iterative execution of ordered tasks. These tasks are performed according to some predefined custom logic. A workflow makes it easy to visualize and implement complex tasks in a sequential manner.
Astera ReportMiner offers workflow orchestration functionality so that users can automate the entire process from the time data enters an organization to when it is stored: from conversion to validation, to loading the data into the preferred destination. For an in-depth understanding of workflows, refer to this article.
ReportMiner automates the data extraction process and expedites data preparation with features such as email/FTP/folder integration, a job scheduler, automated name & address parsing, and auto-creation of data extraction patterns.
Creating a New Workflow
To open a new workflow, go to File > New > Workflow.
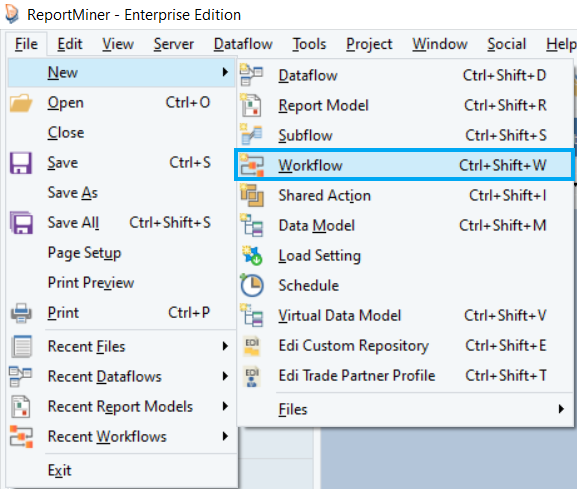
A new workflow will open in ReportMiner. You can see that there is an added Workflow Task section in the Toolbox panel. Click here to learn more about the features and functionalities available in a workflow.
Email/FTP/Folder Integration
With ReportMiner, users can automatically pull files from an email or an FTP source by setting up custom job frequencies, such as every few minutes or on an hourly basis. This eliminates the need to manually download an incoming file from locations such as an email inbox or folder and send it to ReportMiner for further processing.
In this example, we will illustrate how to use the folder watching feature while designing a workflow. The screenshot below shows the workflow designer. In this example, we will deploy the same dataflow on every file that arrives in a folder and orchestrate it with a workflow.
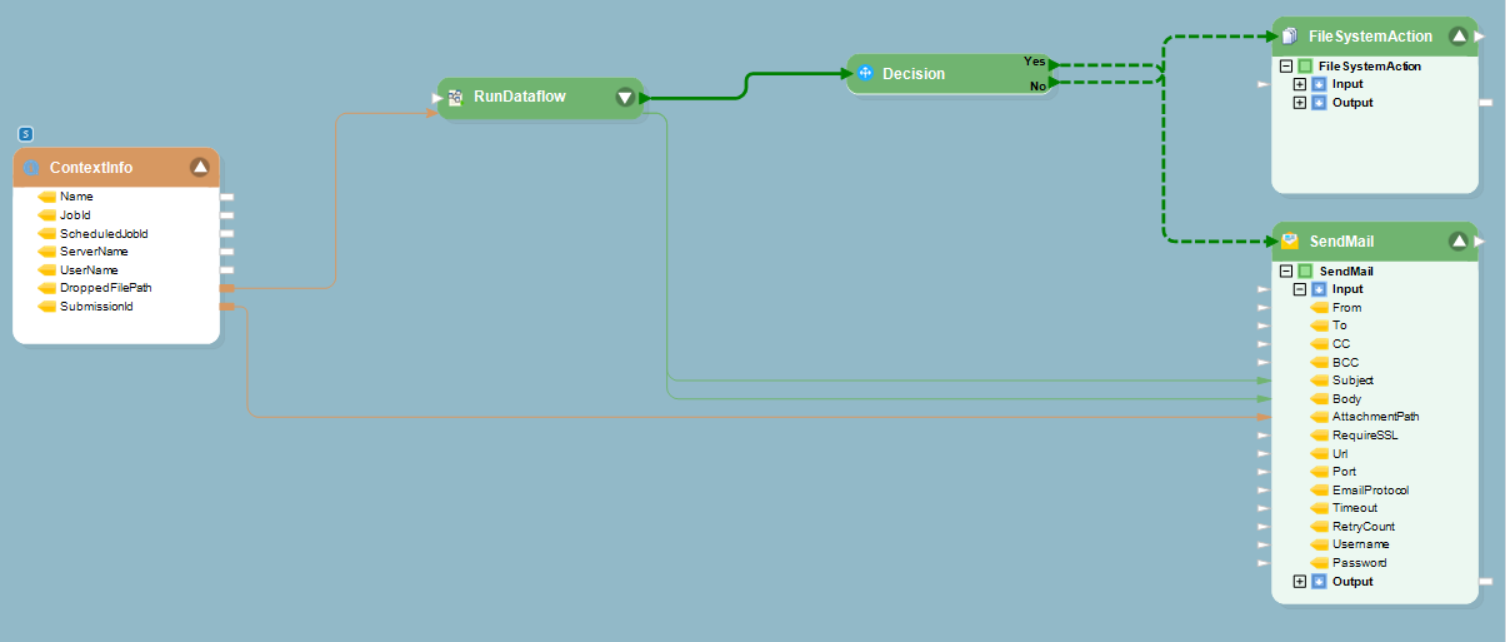
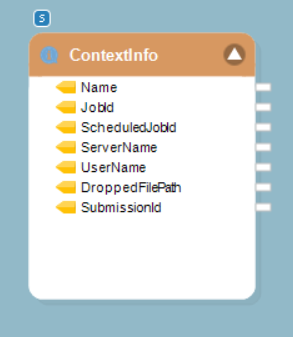
The Context Information object is placed under the Resources section of the toolbox. Using Context Info, dynamic parameters are defined that take up values during the dataflow run time.
This object is useful in directing ReportMiner to watch a folder for every file arrival.
We can also use a File System Item Source here as an alternative. It provides the metadata about files found in a particular folder.
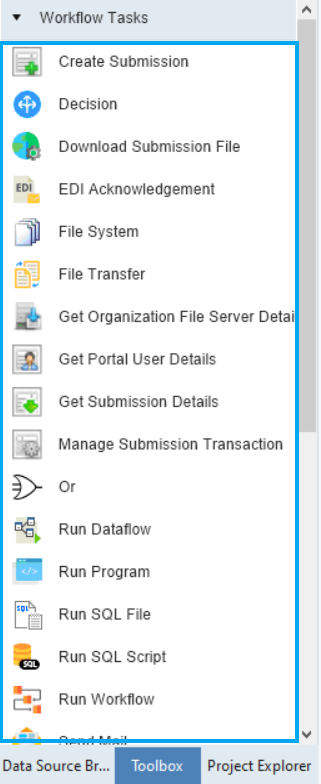
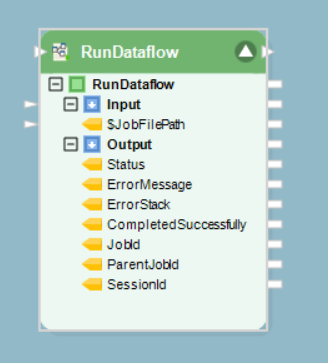
The Run Dataflow Task is placed under Workflow Tasks section of the Toolbox.
This object is used to call and initiate a dataflow in a workflow and orchestrates the data extraction and data validation processes.
There are some other Run tasks including Run Workflow Task and Run Program Task.
In a single workflow, you can use a single or a combination of workflow tasks.
You can also find some process tasks such as such as Decision and SendMail tasks in a workflow. Decision object invokes one of the two paths in a workflow, depending on whether the logical expression inside the Decision object returns a Yes (True) or a No (False) flag.
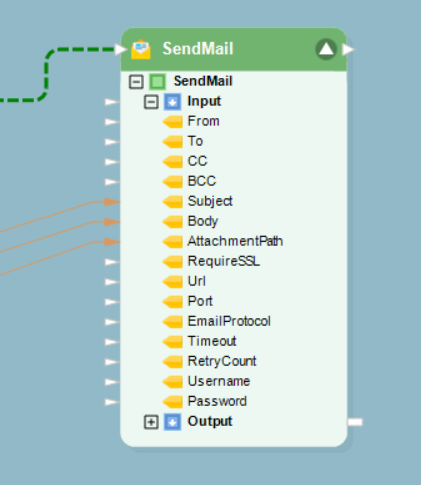
A Send Mail object sends email to the administrator at defined junctions in your workflow. You can place this object anywhere in the workflow as per your requirements.
Other action objects such as [File System] Action](https://docs.astera.com/projects/centerprise/en/9/workflow/creating-workflow-tasks.html#file-system) and File Transfer Task can be used at the end of a process chain to direct ReportMiner as what to do with the data after a successful extraction task.
Scheduling an Extraction Process
Jobs can be scheduled to run in a batch mode or real-time mode using a built-in Scheduler in Astera ReportMiner. In other words, the entire extraction process of data and its validation can be scheduled for a real-time run at the arrival of every new unstructured file.
The Scheduler functionality comes with various options for job frequencies, such as hourly, daily, weekly, or monthly. For real-time processing, the built-in job manager watches for file drops, single or batch, on any specified location and proceeds to executing a workflow automatically.
For more information about the built-in Scheduler, refer to the article on Scheduling and Running Jobs on a Server.
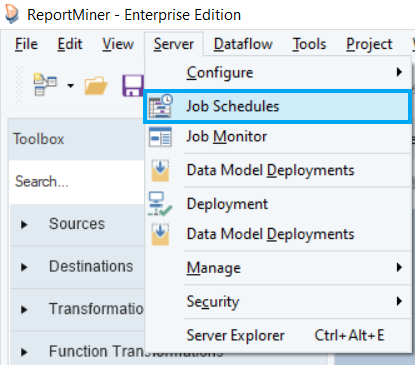
To open the Scheduler in Report Miner, go to Server > Job Schedules.
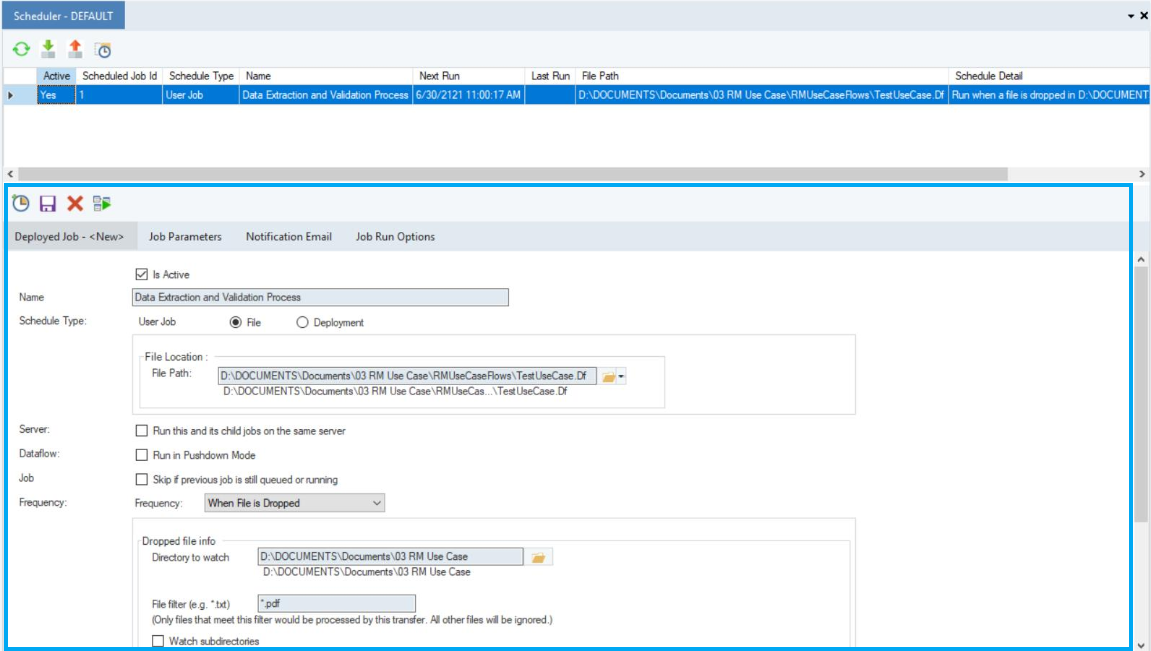
The main screen of the Scheduler provides options to customize a repetitive task, as shown in the screenshot below.
Add a new Scheduler task by clicking on this icon  .
.
Configure the settings of the new scheduled task by going to the Deployed Job tab. Add the status, name and schedule type. Then, define a file path, server and the frequency of the scheduled task. It further provides an option to run the scheduled dataflow in Pushdown Mode.
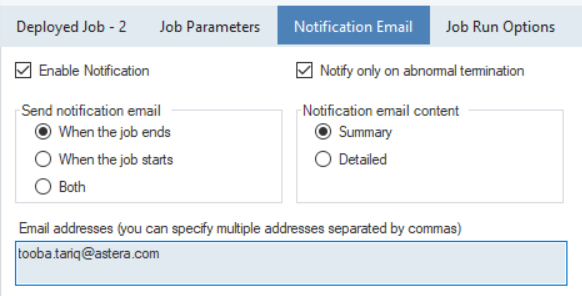
Users can also track the workflow’s progress with ReportMiner’s notification option. Emails can be configured to send alerts about instances such as the beginning of a task, abnormal terminations, completion of workflows, or errors.
Click on  placed above the Deployed Job tab to save this scheduled task. It will now be added to the list of active scheduled tasks. Now upon arrival of every new unstructured file in the specified folder, the process of data extraction validation and conversion will be triggered.
This concludes the ReportMiner Tutorial article.