ReportMiner Tutorial
In this tutorial, we will explore the features of ReportMiner. ReportMiner’s new and improved interface enables business users with little or no technical background to easily accomplish a wide range of data extraction tasks without employing expensive IT resources.
To extract data from a printed document, called data mining or report mining, you will need to create a report model that contains the definition of your document’s structure and, using that report model, extract the report contents into your desti- nation of choice. You can also use your report model in a dataflow, which will enable you to take advantage of the advanced transformations and conversion features of ReportMiner. Here is how this can be accomplished.
Creating a Report Model
The most important component in any report model is the Data region. This region
contains fields that make up the body of your document. Depending on the layout of the document, you can also include a Header and/or Footer in your report model. This will enable you to extract data from those regions in your source document.
If your source document’s layout is hierarchical in nature rather than flat, you can re- flect that in your report model by creating a tree layout with a Data region serving as a parent region for its subordinate regions. Finally, you can add any Append regions as necessary to further customize your report model.
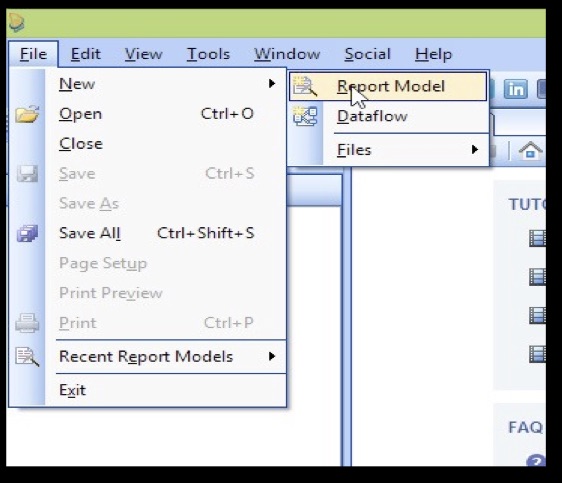
To create a new report layout, go to “File -> New” and select “Report Model.”
ReportMiner supports extracting unstructured data from text, EDI, Excel, PRN, and PDF files. Users can choose any valid file type using a single input box.
Select the report file to be used as a sample file. We will use data from this file to create our report model. Depending on the content type of your data, reading options will change. For example, if you have a PDF file, you can select the scaling factor, font, tab size, and passwords.
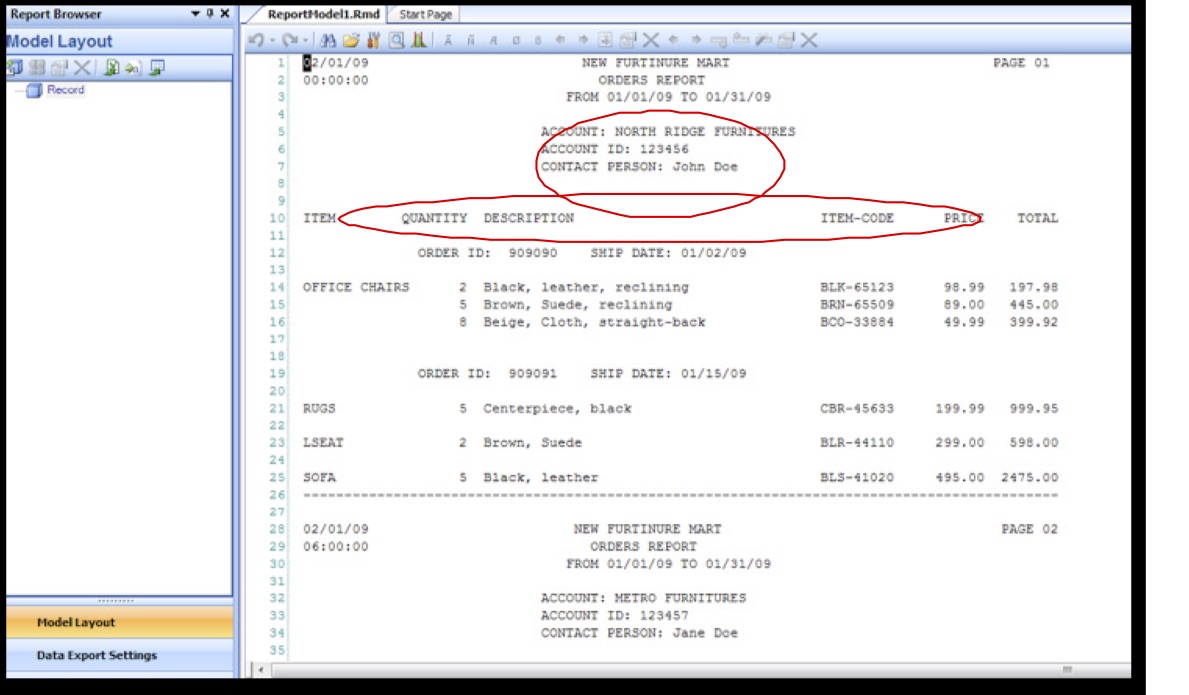
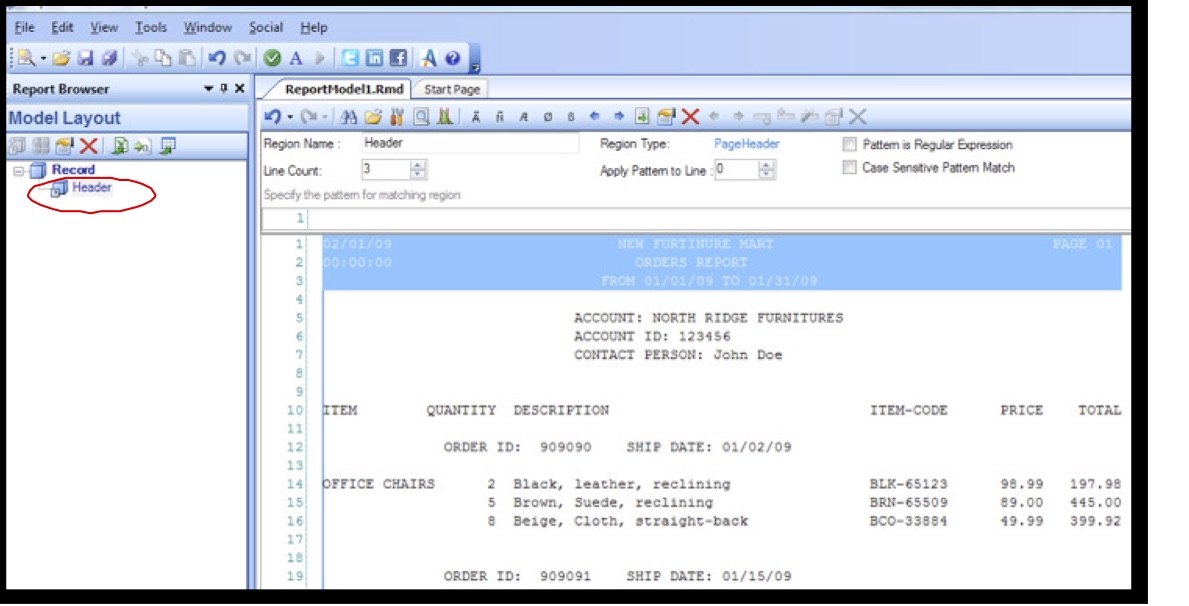
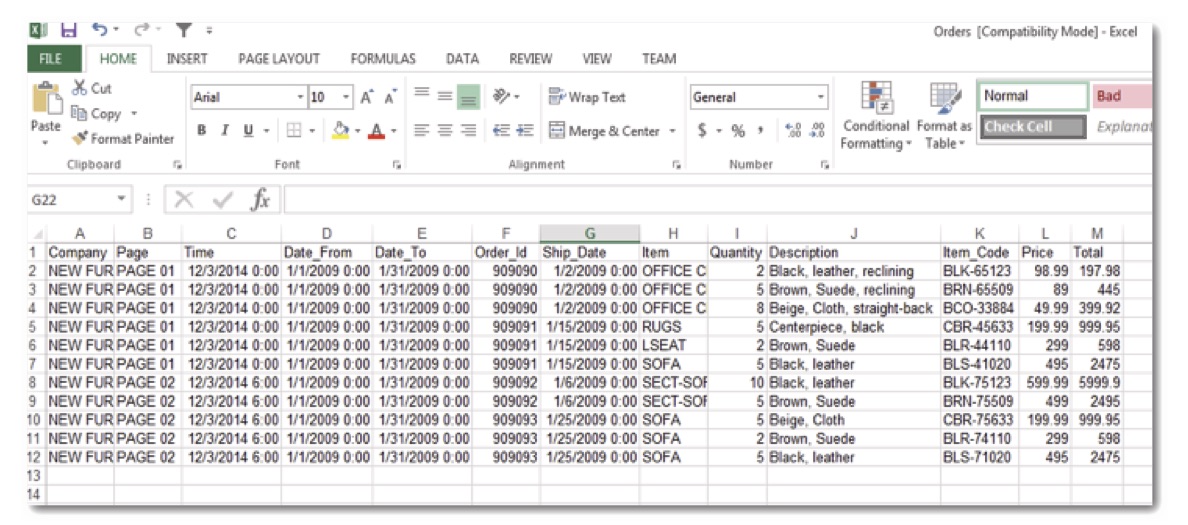
We selected a sample data file for Orders as shown in the screenshot below. The selected file is loaded into the Report Model Editor.
Note: You can also load another source file in the Report Model Editor at a later time. Click the  icon on the toolbar and navigate to the file you want to load.
Let’s take a look at this report. At the top of our Order sample is general account information, followed by order line items, such as Item, Quantity, Description, Item Code, Price, and Total.
Extracting Header Data
Our sample report has two logical regions, the Header region and the Data region. Unlike some other reports you might work with, this report has no Footer region.
The Header is at the very top of the report, spanning three lines starting at the line with the report date.

Let’s create the header in our report model.
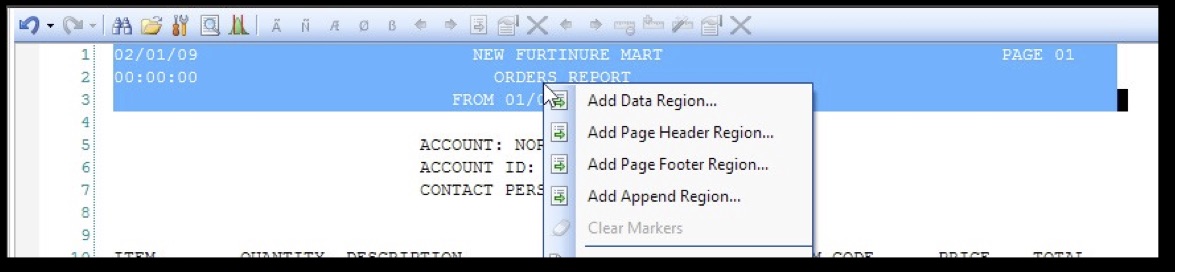
Select *“*Add Page Header Region” in the context menu shown in the screenshot above.
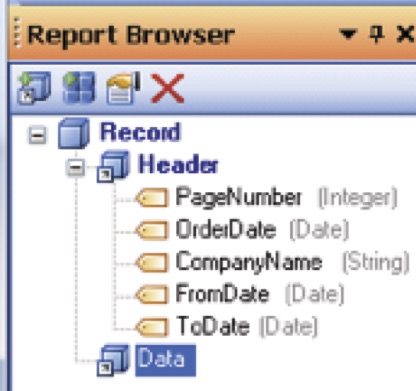
The Report Browser on the left hand side now shows a new node called Header, shown in the screenshot below.

Now, let’s take a closer look at the Header. The Header in our sample always starts with a date, shown at the very first line and in the very first character position of the Header. We can use the date as an identifying pattern for the header.
Any time the  pattern occurs in the file, ReportMiner will treat it as the beginning of the Header.
Let’s enter the  wildcard characters denoting digits, as shown below.
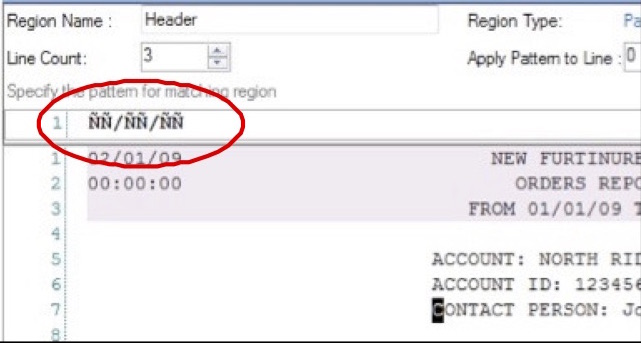
Notice that the Report Model Editor now highlights the header in purple. The Header spans three lines, as shown by the purple block in the editor. The height of the Header, or any other region (i.e., the number of lines that the header spans), is controlled by the Line Count input below the Report Toolbar.
Our Header region has no fields in it yet, so we will now create a few fields, making up the layout of the Header.
Auto Creation of Fields
In ReporMiner, you can add fields to a region manually one by one, or ReportMiner can create the fields automatically by scanning the region’s sample for repeating patterns of data.
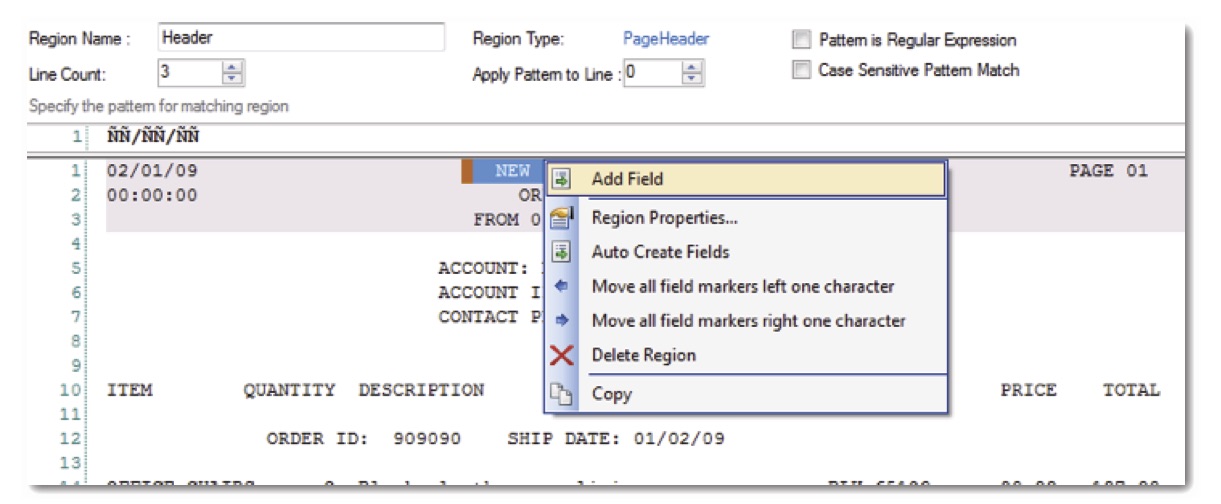
Right click within the header area, and select “Auto Create Fields.”
ReportMiner will scan the source file and create fields based on the layout of the header.
In our example, the Auto Create Fields feature added five fields. They are now displayed in the Report Browser under the Header node. Notice that our new fields are also highlighted in darker purple in the Report Model Editor.
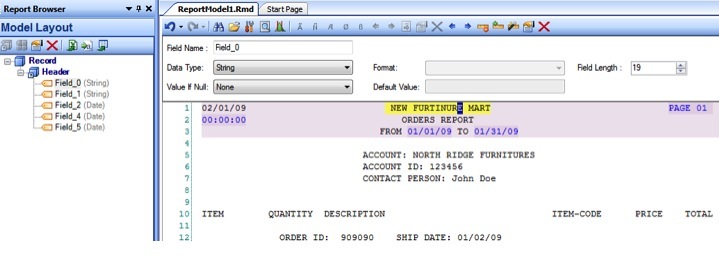
The fields created this way are assigned unique names, such as Field_0, Field_1, and so on.
Editing Fields
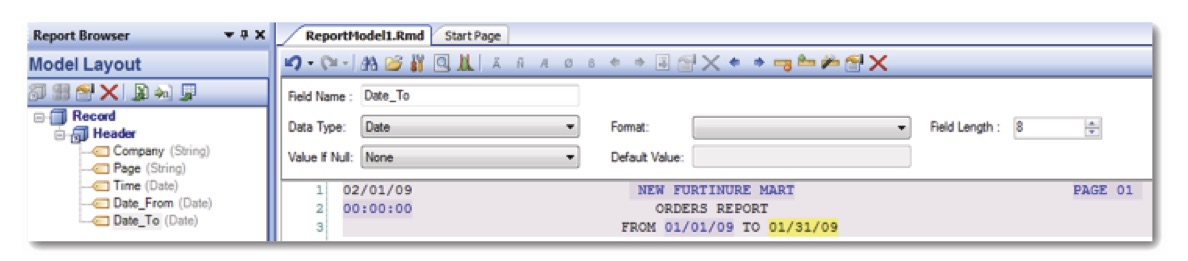
You can customize any field as needed. Let’s rename our new fields to make them more descriptive.
Double click a field in the Report Browser and enter a new name.
Or:
Select a field in the Report Model Editor (the selected field is highlighted in yellow), right click, and select “Field Properties” and type in the new field name in the Properties dialog box.
We can also change a field’s name, data type, and a few other properties by using the controls below the main toolbar, as shown in the screenshot below.
Defining Field Properties
You can also change other field properties, such as start position, length, and height, among many others, using the Field Properties dialog box.
Right click your field and select “Field Properties.”
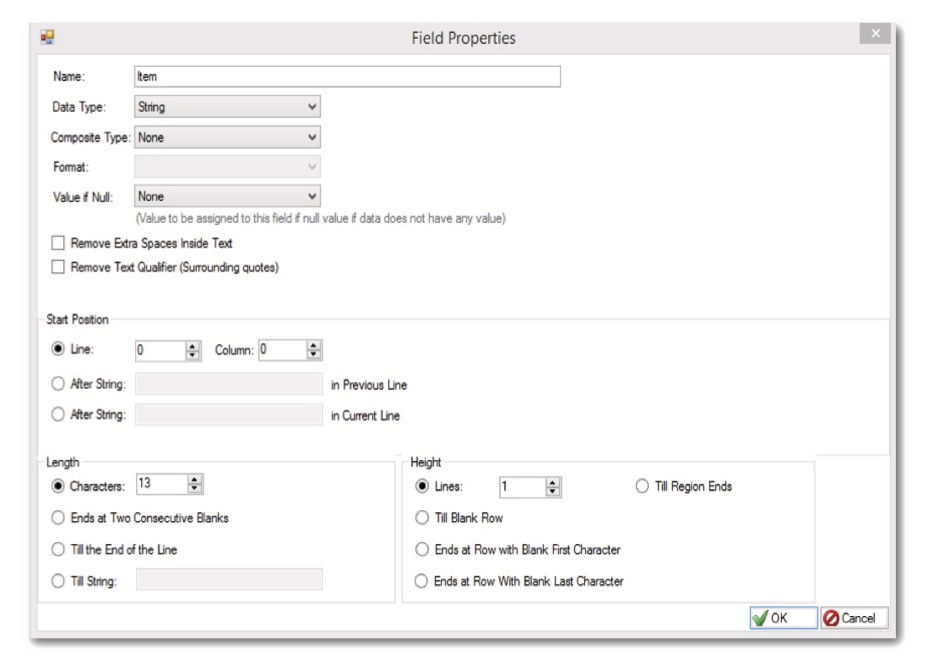
Under “Start Position” you can specify where your field starts. If your data does not always line up you can use the “After String:” options. If the data you want to extract always appears after a specific string (in a previous line or in the current line) within your report you can specify that here.
You also have the option to adjust the length and height as needed. You can do so in the field properties dialog box or use the appropriate icons on the Report Model editor toolbar.
Adding Formula Fields
ReportMiner enables you to create any number of formula fields in your report model. A formula field pulls data from another field or fields in your model and it can also apply an expression or formula of your choice to derive the field’s value.
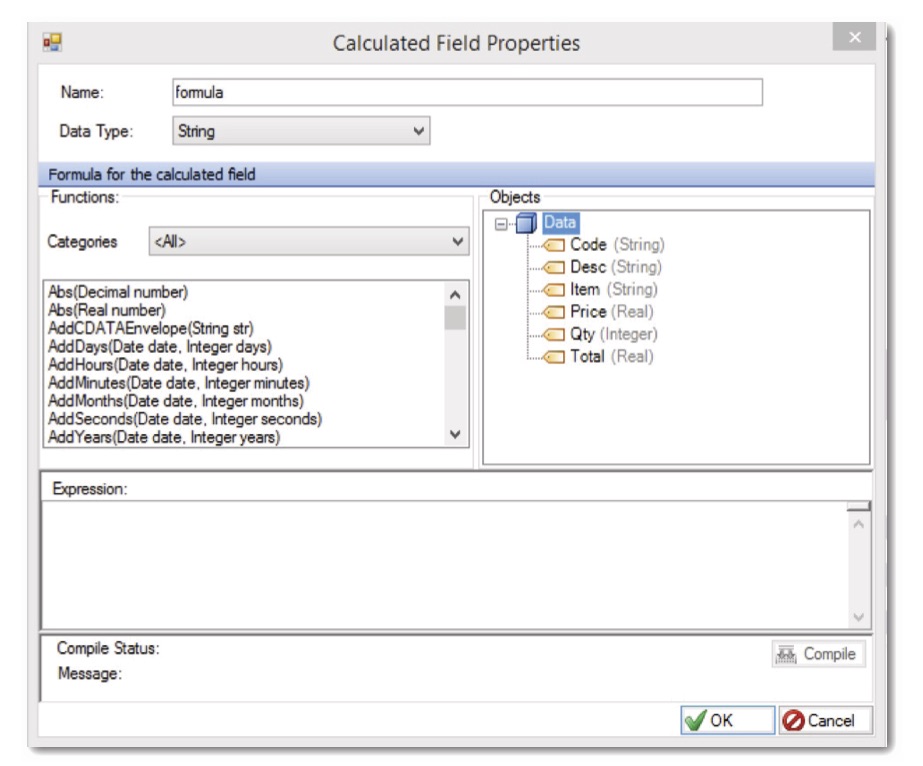
You can change the field name from the formula to the name of your choice. Input your formula and make sure to click the Compile button to verify that it works. For example, if you want to add a new field with the price 20 percent off, you would input into the expression box the formula: Price – Price * .2
Click OK. This closes the dialog and the formula field is added to the tree. Click the Preview icon on the toolbar to check that your formula works as expected.
Creating a Data Region
Now that we created the definition of the Header, let’s look into the main region of the report. As we saw earlier, the main region starts with the Account Name and then includes Account Number, Contact Name, and, finally, specific order details. Let’s assume that we are interested in extracting only the order details and order items for the respective orders.
Right click anywhere in the main area of the report (outside the Header), and select “Add Data Region” from the context menu.
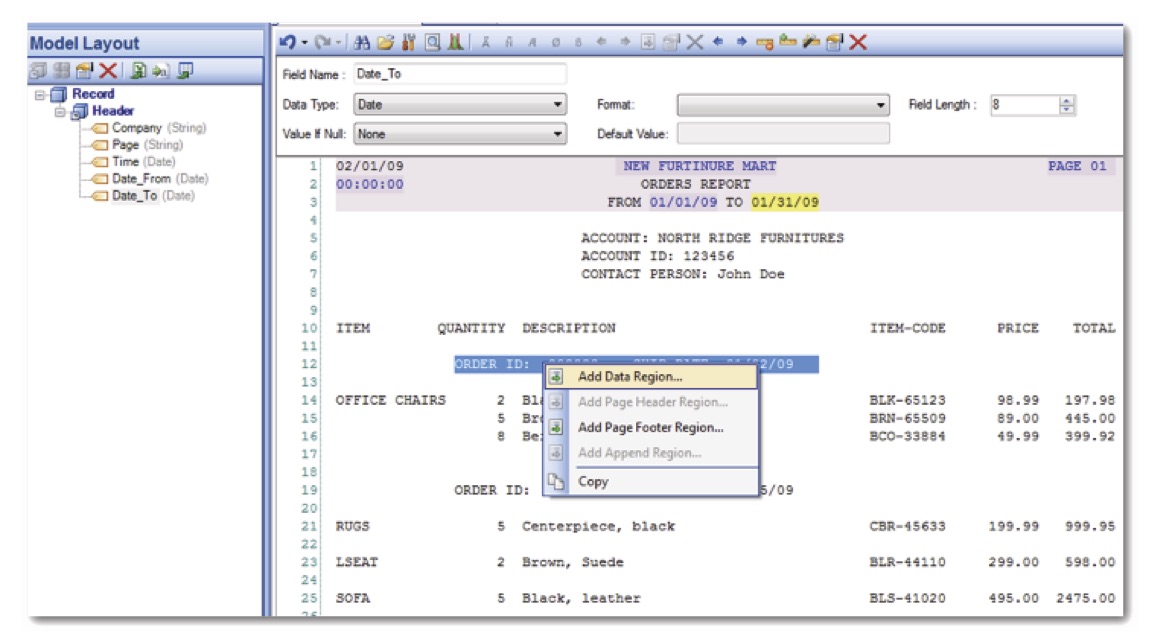
This will add a new Data node in the Report Browser. This new node has no fields at this point.
Now we will identify the region using appropriate masks. In this case, it’s easy to identify orders as they always start with “ORDER ID:” at the same position. Place the cursor at the position where the text “ORDER ID” begins, as shown in the screenshot, and enter “ORDER” in the pattern text input.
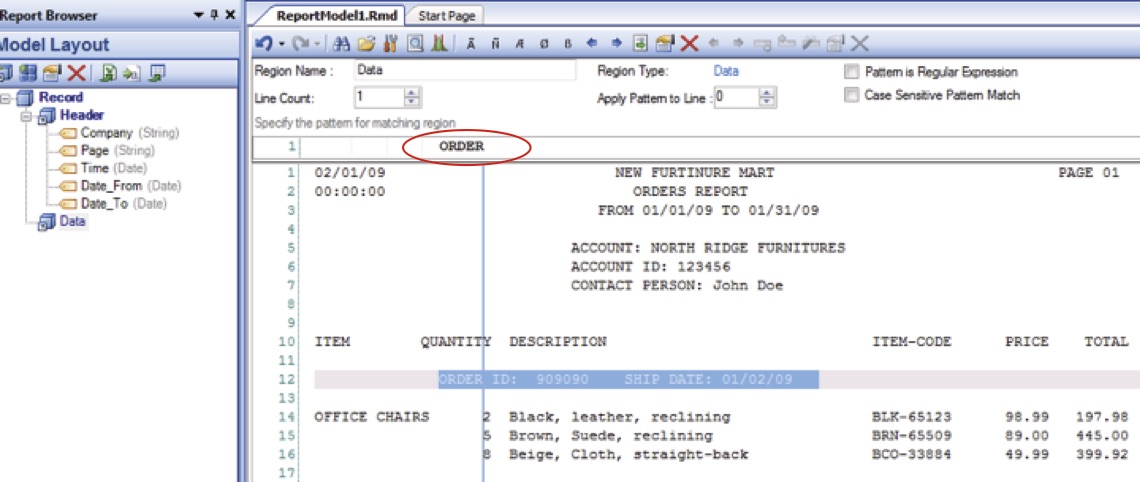
The Report Model Editor highlights any occurrences of orders in the report. Remember that we can easily adjust the height of the region by using the Line Count input.
Let’s rename our region Order. Now our report has two regions: Header and Order.
Next, let’s add fields that make up an Order. In our example, the Order has two fields at the top line of the region - Order ID and Ship Date. Let’s add these fields manually, one at a time. Highlight a text area with the mouse, right click it, and select “Add Data Field” from the context menu.
Auto Creation of Regions
In addition to creating a region by entering a pattern text, you can also let ReportMiner figure out the pattern for you. This new feature really simplifies the creation of regions. You can create a region with just a few mouse clicks, by using a combination of positive and negative line markers.
Once you have loaded your report, go to the left side of your lines and select a couple of sample lines that should belong to the current Region. You will see a green (positive) marker appear where you have selected.
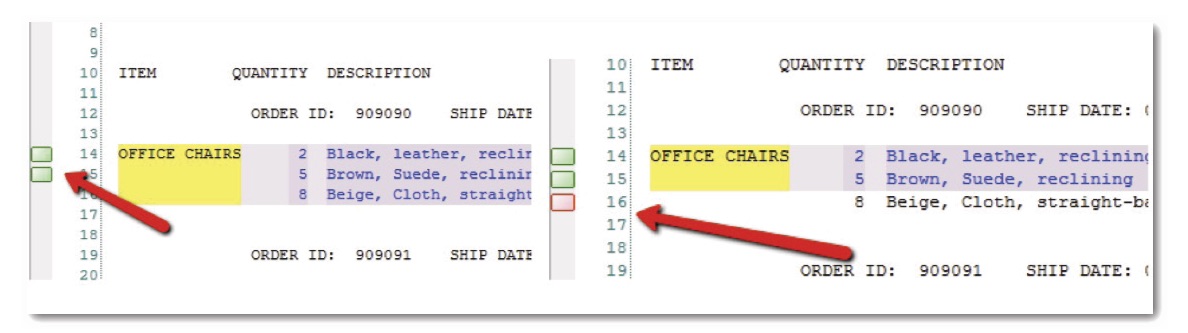
ReportMiner will automatically screen the text for a pattern and highlight the area. Your region has now been created.
You can adjust it by clicking the green marker or clicking to the left of a line that is highlighted with no marker on it. This will make a red marker (negative) appear which will un-highlight that line so that it is excluded from the region.
Creating a Collection Region
Next, let’s take a closer look at the Order Region. Notice that each customer can have one or more orders, and each order may have several order items in it. In ReportMiner terms, we say that the region has a collection of items, or to put it simply, a Collection.
Let’s add order items to the Order. After selecting the Order node in the model tree, we select a row underneath the order that represents an order item and then right click it and select “Add Data Region” from the context menu.
We can identify this region by the repeating pattern of item code. We are going to use a data mask in the text pattern input to match with the item code. To that end, enter “Match Any Alphabet” three times, followed by a hyphen, and then “Match Any Digit” five times as shown in the screenshot below.
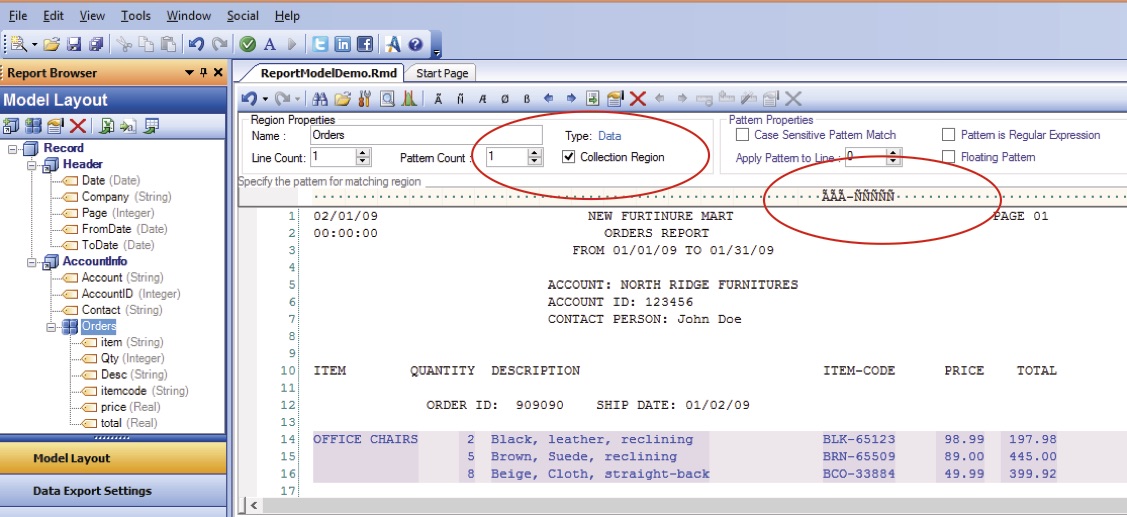
Whenever a node has a collection of items, we need to turn on its Collection Region property as shown in the screenshot above. Notice that the appearance of the icon for the Item node in the Report Browser changes to help identify this node as a collection. When we add a Collection Data Region via the context menu in the report model tree, the Collection Region property is enabled automatically.
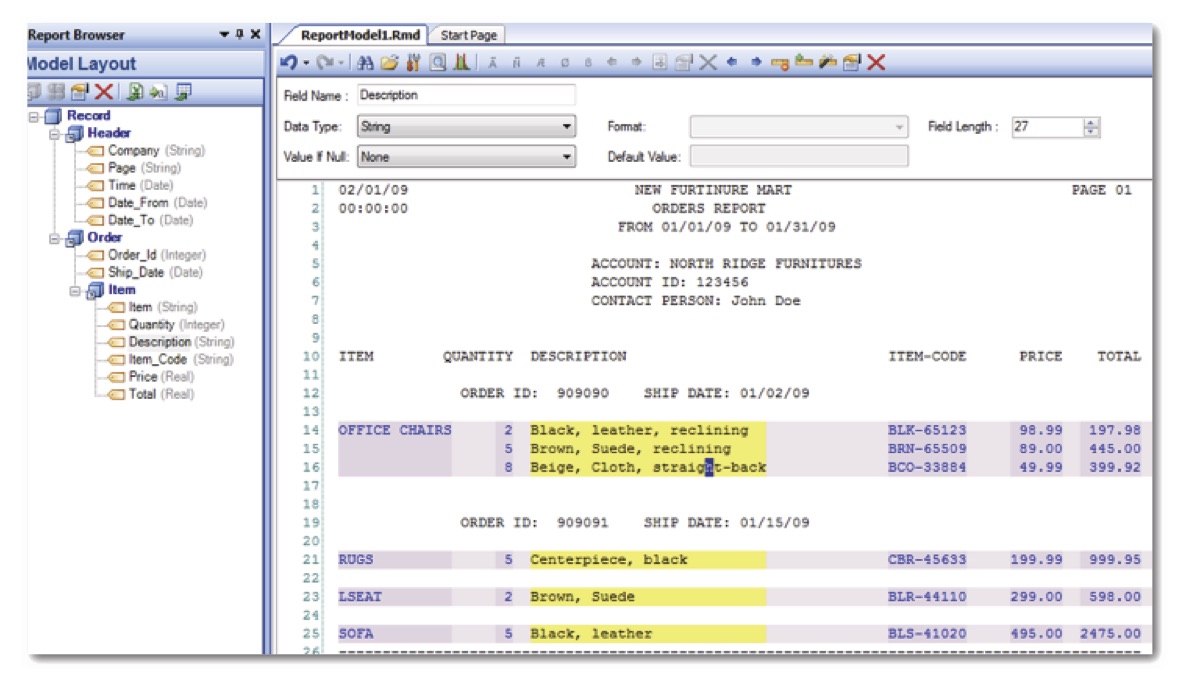
Finally, let’s add the fields for the Item collection region using the Auto Create Fields feature, or manually. After assigning proper names to the fields we added, the model is completed and looks as shown in the screenshot below.
Saving and Testing a Report Model
A report model is used by ReportMiner to correctly process data coming from the report source. Report models are assigned an *.rmd extension.
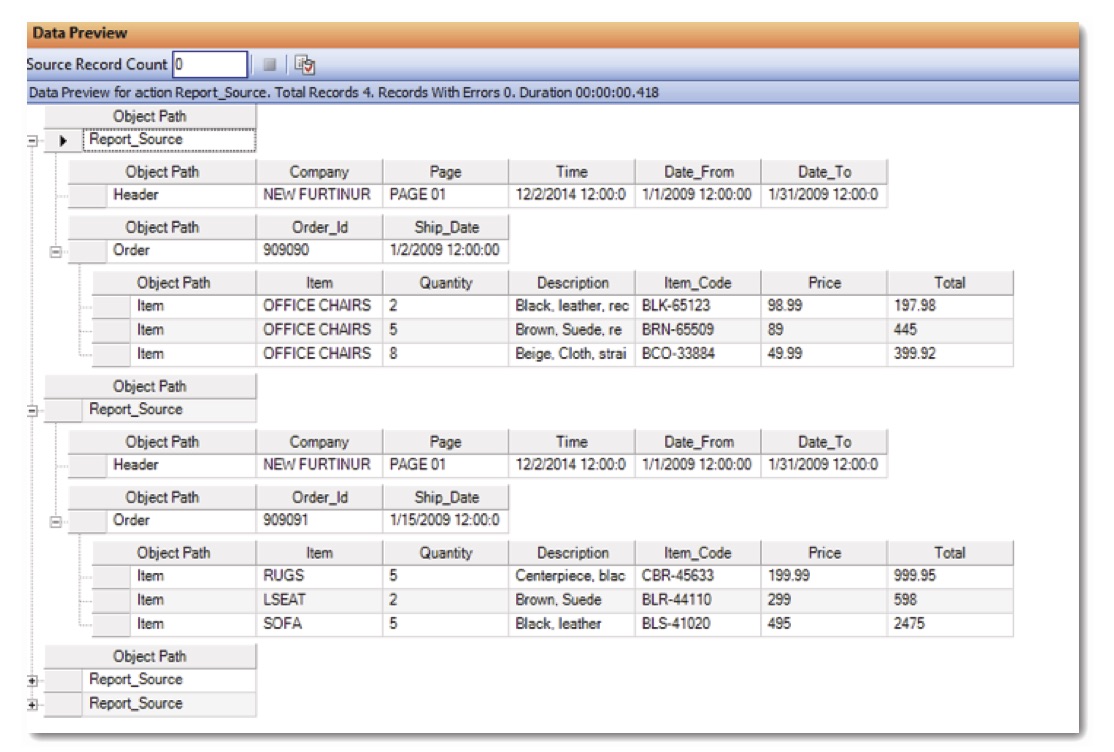
Let’s save our report model by clicking the Save icon on the main toolbar. Now we can test the model by previewing our data to confirm that our sample report is parsed as expected.
To test the model and preview the extracted data, click the  icon on the top toolbar.
This opens the Data Preview window, showing the entire report structure with the actual values for all the fields we have defined above.
Data Statistics and Summary
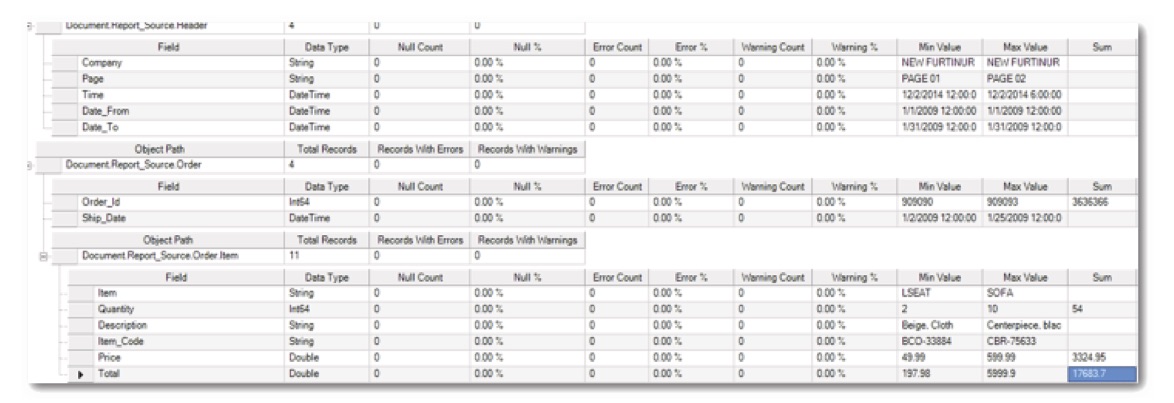
ReportMiner enables you to instantly see statistics of extracted data fields, including minimum and maximum values for each field, record counts, error and null counts, averages, etc.
To view detailed statistics of extracted data, click on the  button in the toolbar.
The Quick Profile window will open with detailed statistics of extracted data as shown in the screenshot below.
Exporting Data
ReportMiner makes it easy to export your report data to a number of destination types. You can export to Excel, delimited files, fixed length files, or to a database such as Microsoft SQL Server, Access, PostgreSQL, and MySQL.
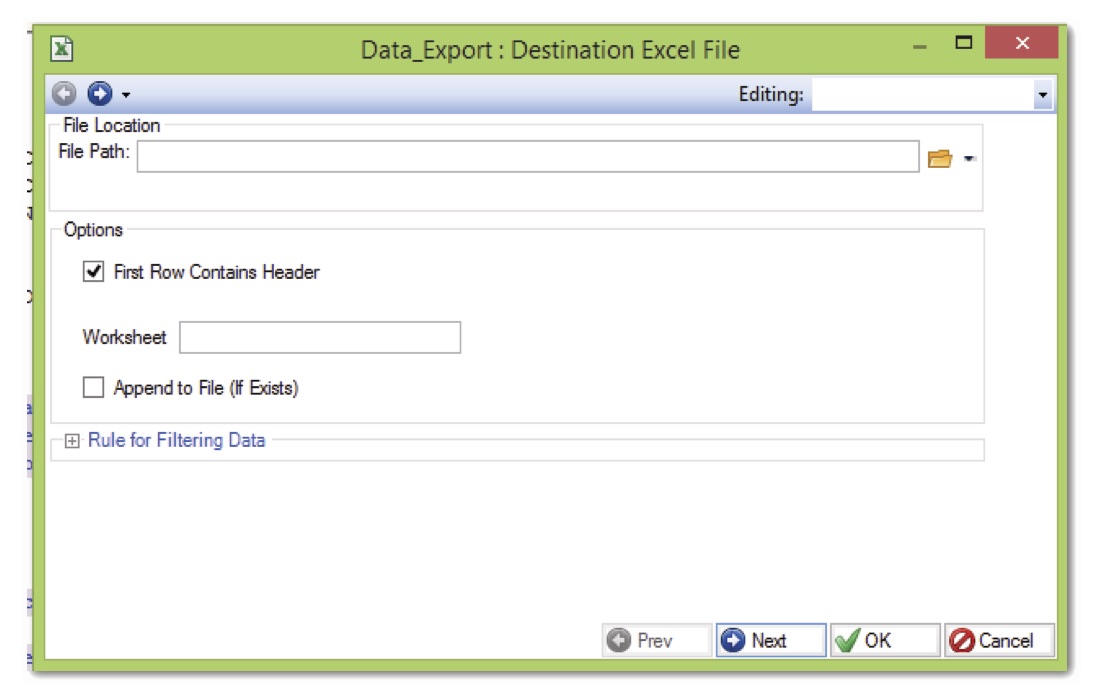
For example, if you wish to export data to Excel, click on the  button in the Data Export Settings toolbar. An export wizard will pop up and walk you through the steps for the export.
In the first screen, you will choose the output file location. Clicking “Next” will take you to the layout grid that shows all the fields to be exported, their sequence, header text, and the source field used to extract data from the source file. When you click on OK, the wizard screen will close and begin the extraction. You can see the progress in the progress window.
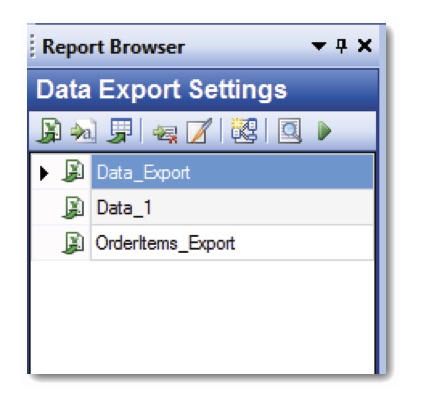
The Data Export Settings window is also highlighted and a reusable export setting is added to the list. You can manage your reusable export settings in this window. You can edit existing settings, remove them, or add a new one. You can trigger a fresh transfer from this window as well.
After the export has finished you can see the progress and a link to the destination file (if exporting into a file), as well as the log file. If your transfer encountered any errors, you can click on the link for the log file and view the error log.
You can also create export settings and transfer data to delimited files or databases using the  toolbar buttons respectively.
Now let’s take a look at some additional functionality that ReportMiner offers to help you customize your extraction.
Selecting Fields and Regions
To select a field, left click on it in the Report Browser’s tree. The field is highlighted in yellow in the Report Model Editor. Some of the more common field properties are displayed in the top pane of the editor.

To select a region, click on it in the Report Browser’s tree. The region is highlighted in light purple in the Report Model Editor, and the fields in the selected region are also highlighted in darker purple. The top pane shows the properties that are applicable for the region.
Managing Field and Region Properties
To view and update all other properties of a field or a region, right click on a field (or region) in the Report Browser, and select “Edit Field” (or “Edit Region”) from the context menu.
The same functionality is also available on the top toolbar, by pressing the  icon.
icon.
You can also access field properties by right clicking the field in the Report Model Editor and selecting “Field Properties” from the context menu.
Renaming Fields and Regions
To rename a field, double click it on the tree in the Report Browser and enter a new name.
To rename a region, double click it on the tree in the Report Browser and enter a new name.
You can also rename a field or a region by entering the new name in the Name input on the top pane.
Deleting Fields and Regions
To delete a field, right click it in the Report Browser or Report Model Editor and select “Delete Field.”
To delete a region, right click on a region (or a field inside the region) and select “Delete Region” from the context menu. Note that this action will also delete any fields in that region.
Customizing Fields
After your field has been created, you can change its start position by moving it a number of characters to the left or to the right. Right click on a field and select “**Move Field Marker Right One Character”**or “**Move Field Marker Left One Character”**from the context menu. Repeat as needed to move the field the desired number of characters.
Note that the same functionality is also accessible from the top toolbar via the  icons accordingly.
You can also change the field length by selecting “Decrease Field Length By One Character” and “**Increase Field Length By One Character”**from the context menu. Repeat as many times as needed to change the field length by the desired number of characters.
Note that the same functionality is also accessible from the top toolbar via the  icons.
To auto determine field length based on the available sample data, right click a field and select “Auto Determine Field Length” from the context menu. Or click the  icon on the top toolbar.
Alternatively, you can also move all fields within the same region left or right by a specified number of characters. To do this, right click on a region or field and select “Move All Field Markers Left One Character” or “Move All Field Markers Right One Character.” You can also use the  icons on the top toolbar.
Note: To undo any action in the editor, use the Undo dropdown menu on the toolbar or press CTRL + Z.
Working with PDFs
Go to “File > New > Report Model.”
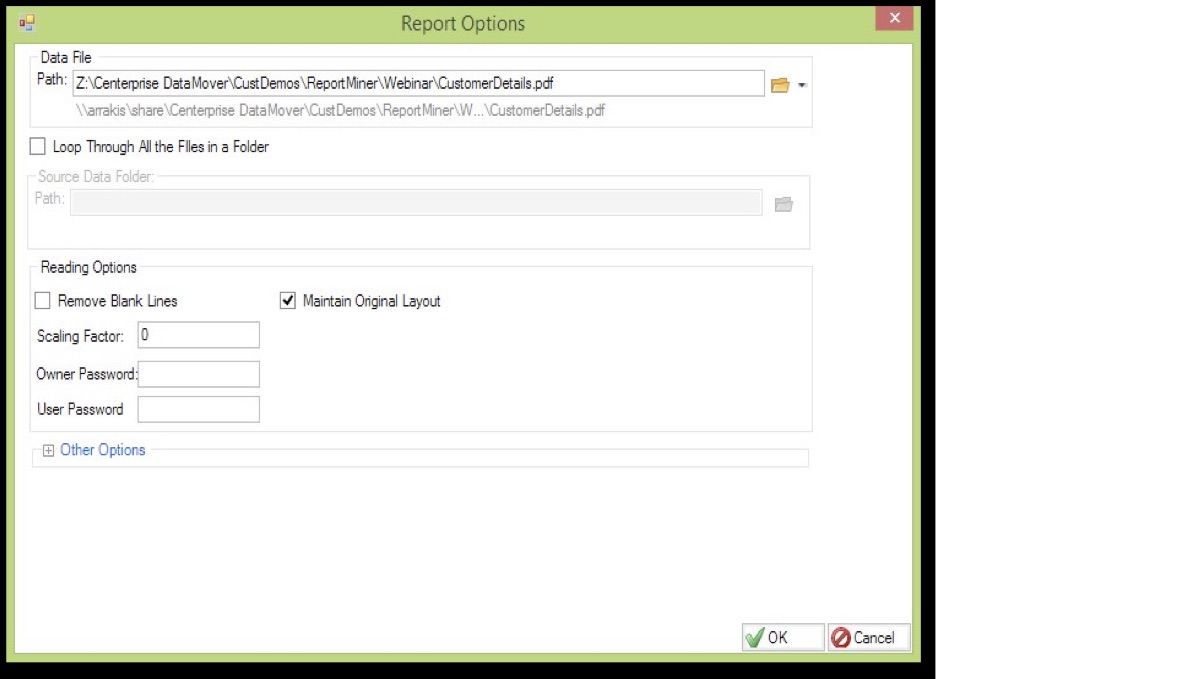
Point to the PDF you will be using. Once you do this the PDF options will appear.
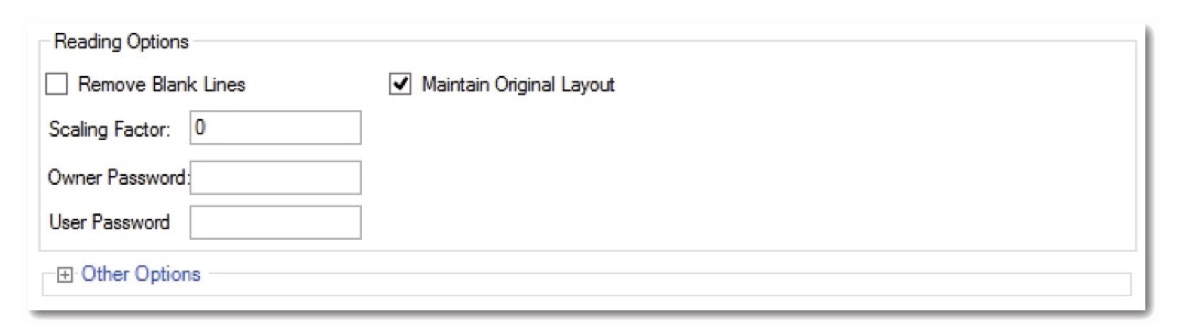
You have the option to “Remove Blank Lines,” “Maintain Original Layout,” and adjust the “Scaling Factor.”
The recommended scaling factor is 0 but this may need to be adjusted depending on your PDF.
If your PDF is password protected, here is where you will enter the password.
Looping Through a Folder (Enterprise Edition Only)
ReportMiner enables users to run multiple reports with one report model by looping through a folder.
Create a folder that contains all of the reports you would like to export through the one report model.
Click the  icon to open the Report Options dialog. Here you will see the option “Loop Through All Files in a Folder.”
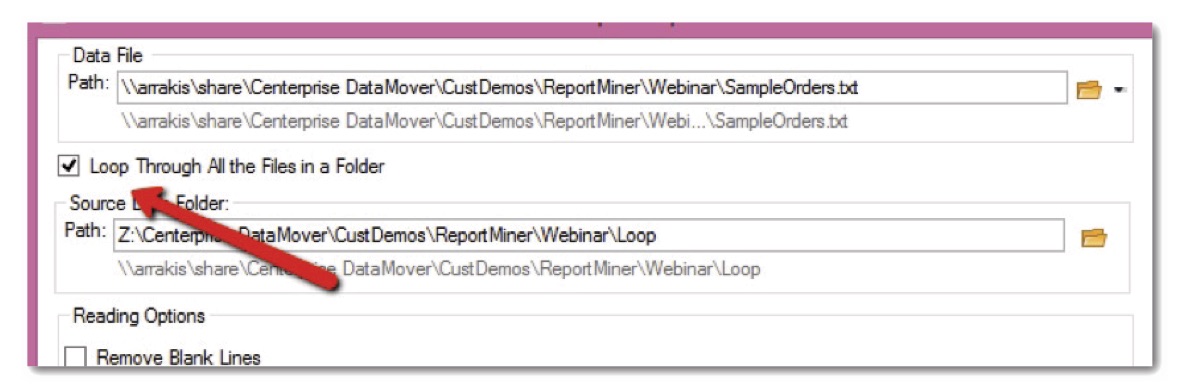
Check this option and point to the folder that contains all of your files and select OK. ReportMiner will go through all files and run them through the report model. When you can preview your data, ReportMiner will go through each file in the selected folder, reading its contents and showing extracted data.
Auto Parsing of Names and Addresses
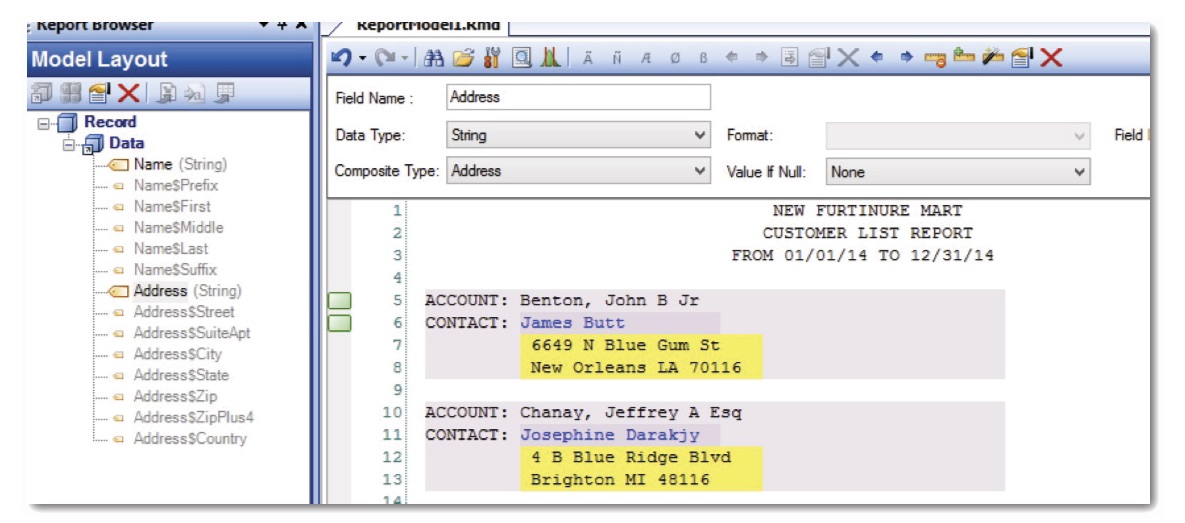
ReportMiner has a feature that enables you to automatically parse your name and address data. ReportMiner will break up your name and address data into separate components. For example: Name: prefix, first, middle, last, suffix and Address: street, suite, city, state, zip, country.
Once your region has been created, highlight the name area, right click and select “Add Name Field.”
You can do the same for addresses. Highlight the address area, right click and select “Add Address Field (US).”
ReportMiner will automatically create your name and address fields by breaking them up into their different components.
Using Dataflows
ReportMiner enables users to build and run dataflows. A dataflow is a graphical representation for sources, destinations, transformations, and maps. Report models can be used as sources in dataflows in order to leverage the advanced transformation features in ReportMiner. Let’s add the report model to a dataflow so we can read the entire source report and feed it to a destination object.
Go to “File -> New -> Dataflow.” This creates a new dataflow.
Using the Toolbox pane, expand the Sources category, and select “Report Source.”
Drag and drop “Report Source” onto the Designer.
Double click the ReportModel1 object that we just added or right click it and select “Properties” to open the Properties dialog.
Using the Properties dialog, enter the path to the report source file and the report model. The report model location should point to the report model we created and saved earlier.
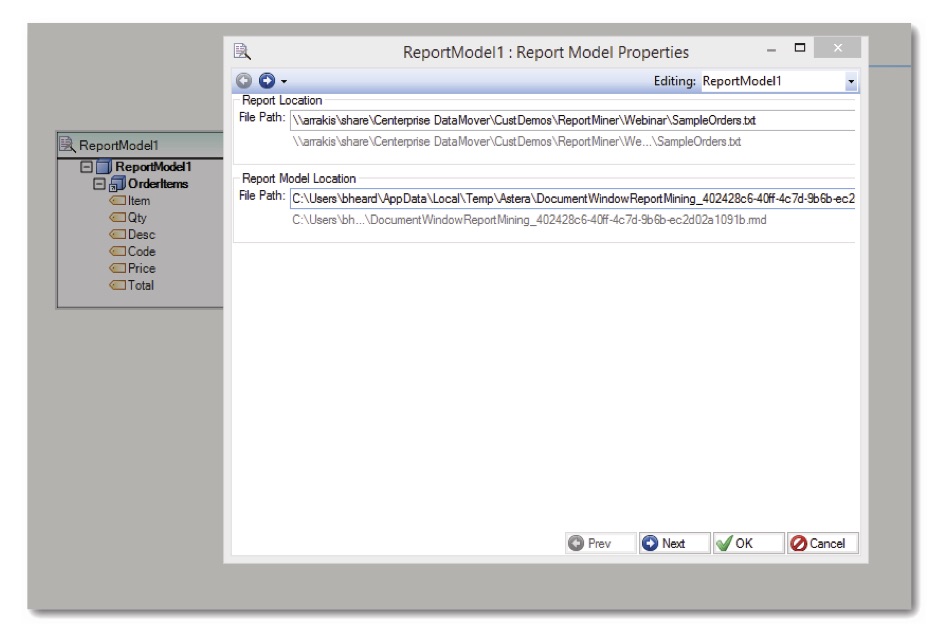
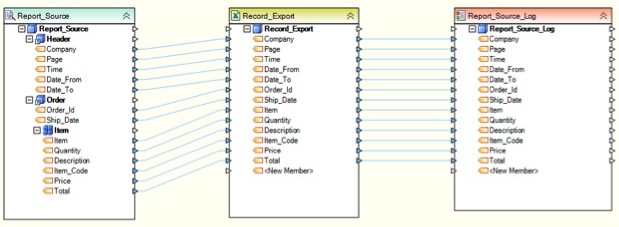
Click OK to close the dialog. The ReportModel1 object shows the report structure according to the report model we created.
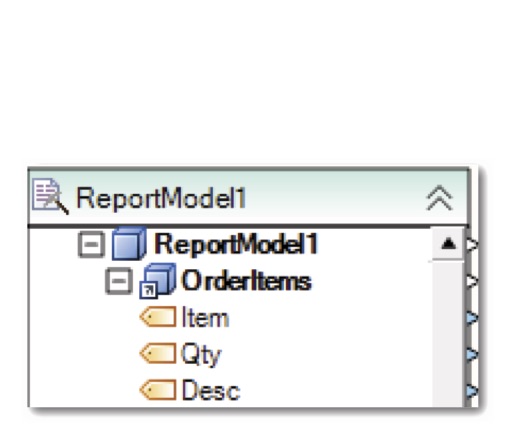
You may need to expand the tree nodes to see all the child nodes under the root node. Our new report source is ready to feed data to the downstream objects in our dataflow.
Using PDF Forms in Dataflows
ReportMiner enables you to extract values from PDF forms.
To work with PDF form sources, go to “File > New > Dataflow.”
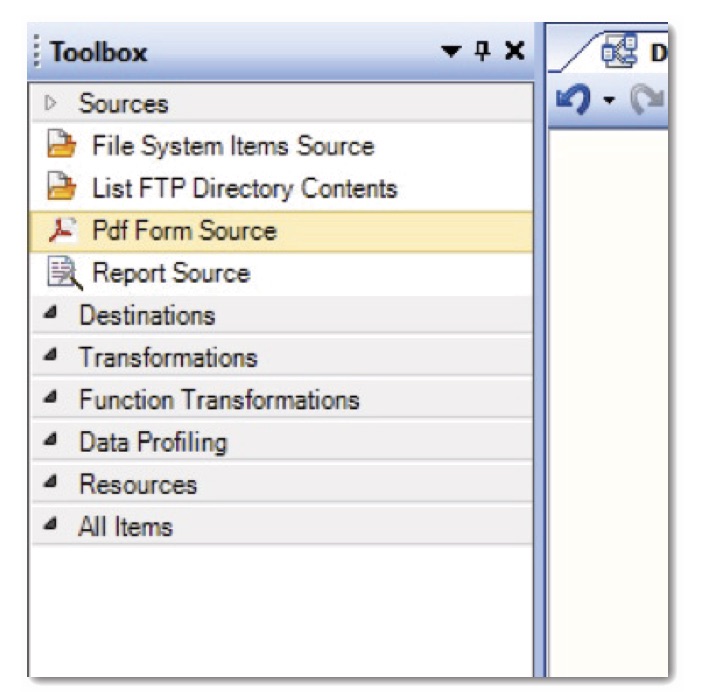
Drag the “PDF Form Source” object onto the dataflow (located under the Sources section in the Toolbox).
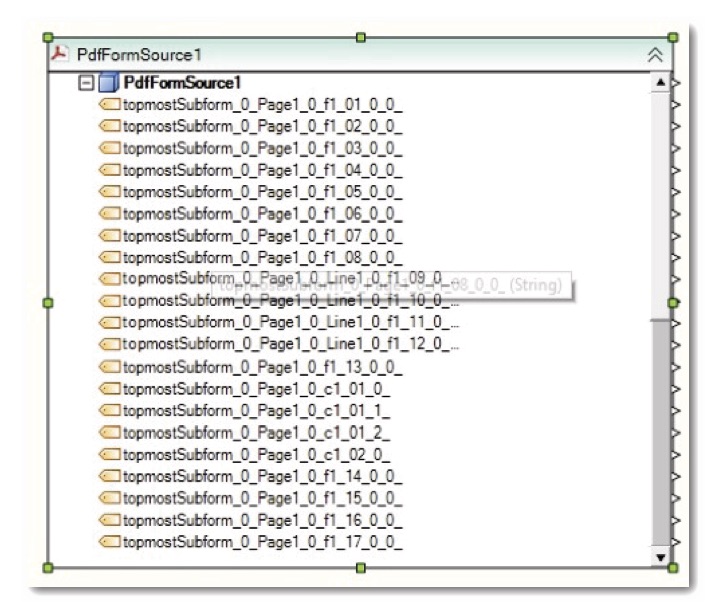
Open the “Object Properties” box. In the Properties dialog, navigate to the PDF form file you will be using. Close the Properties box. The object refreshes, showing the fields that make up the PDF form. You can now preview the output to see actual values in the form.
Creating Dataflows from Export Settings
There is a way to create dataflows directly from the Export Setting Browser. Look for the  button in the Export Settings Browser toolbar. Select an existing export setting and click on this button. A new dataflow will be created and opened in a new window as shown below. Please refer to the Astera Centerprise Data Integrator user manual to learn more about dataflows.